Fine & Studio Arts at Ferris State University
What traits are you looking for in a school for Fine & Studio Arts, consider the program at Ferris State University. We’ve gathered the following information to help you decide.
Ferris State University is located in Big Rapids, MI.
During the most recent reporting year, 24 fine & studio arts degrees were granted at Ferris State University.
Featured schools near , edit
Online & Distance Learning at Ferris State University
Online coursework is an option at Ferris State University. Of 9,959 students, 1,655 (17%) were enrolled entirely in distance education and 3,138 (32%) took at least some classes online.
Fine & Studio Arts Rankings at Ferris State University
Use these rankings to compare Ferris State University’s Fine & Studio Arts program against other schools offering the same major.
Bachelor’s-Level Rankings
| Ranking | Scope | Rank |
|---|---|---|
| Best Value | Michigan | #5 of 16 |
| Best Schools (Quality) | Michigan | #11 of 16 |
| Best Value | Great Lakes (Region) | #25 of 80 |
| Best Schools (Quality) | Great Lakes (Region) | #59 of 80 |
| Best Value | Nationwide | #261 of 662 |
| Best Schools (Quality) | Nationwide | #502 of 666 |
Master’s-Level Rankings
| Ranking | Scope | Rank |
|---|---|---|
| Best Value | Michigan | #5 of 16 |
| Best Schools (Quality) | Michigan | #11 of 16 |
| Best Value | Great Lakes (Region) | #25 of 80 |
| Best Schools (Quality) | Great Lakes (Region) | #59 of 80 |
| Best Value | Nationwide | #261 of 662 |
| Best Schools (Quality) | Nationwide | #502 of 666 |
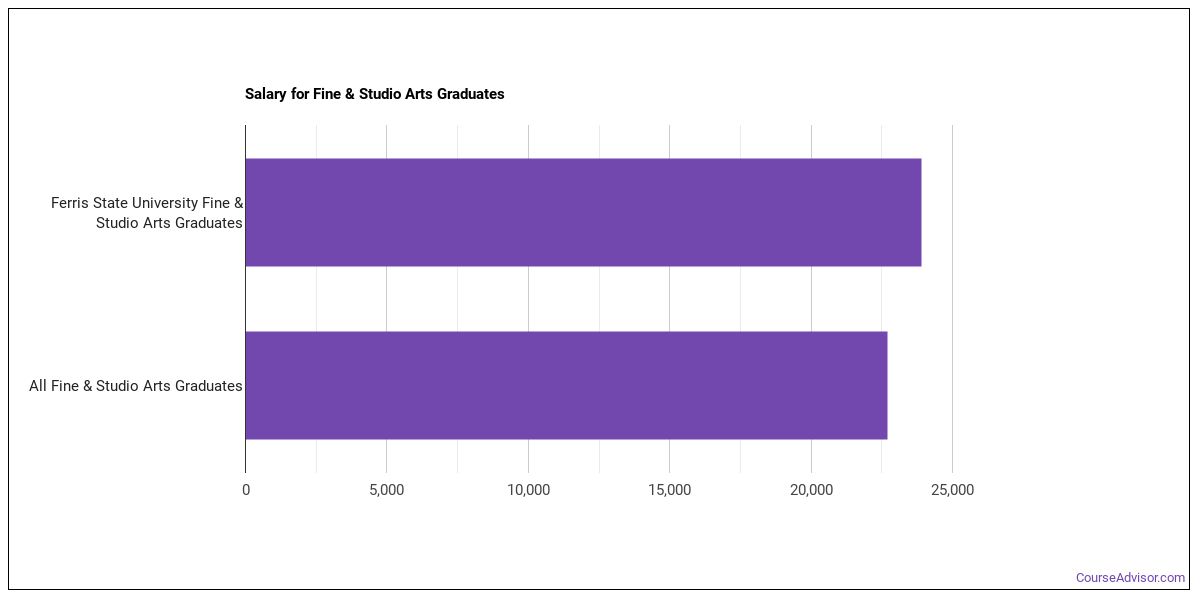
Earnings for Fine & Studio Arts Graduates from Ferris State University
Students who complete Ferris State University’s Fine & Studio Arts program earn at the following median levels (per the U.S. Department of Education’s College Scorecard):
| Years After Graduation | Median Earnings |
|---|---|
| 2 years | $30,984 |
| 3 years | $26,545 |
| 4 years | $37,605 |
| 5 years | $35,717 |
Is this above or below average for the school? Four years after graduating, Fine & Studio Arts graduates from Ferris State University earn a median of $37,605, compared with $62,925 for all Ferris State University graduates — about 40% lower than the school-wide median.

Median Debt at Graduation
Typical debt at graduation for Fine & Studio Arts graduates from Ferris State University stands at $27,000.
Student Demographics & Diversity
Take a look at the diversity of Fine & Studio Arts graduates at Ferris State University, broken down by degree level.
Across all degree levels, Fine & Studio Arts graduates at Ferris State University are 58% women (14) and 42% men (10).
Fine & Studio Arts Associate’s Program at Ferris State University
Of the 10 associate’s fine & studio arts degrees awarded at Ferris State University, 60% were women (6) and 40% were men (4).

The following table and chart show the race/ethnicity of Fine & Studio Arts associate’s degree recipients at Ferris State University.
| Race / Ethnicity | Number of Graduates |
|---|---|
| White | 5 |
| Hispanic / Latino | 2 |
| Asian | 1 |
| Two or More Races | 1 |
| Unknown | 1 |

Minority students account for 40% of Fine & Studio Arts associate’s degree recipients at Ferris State University, below the national average of 61%.*
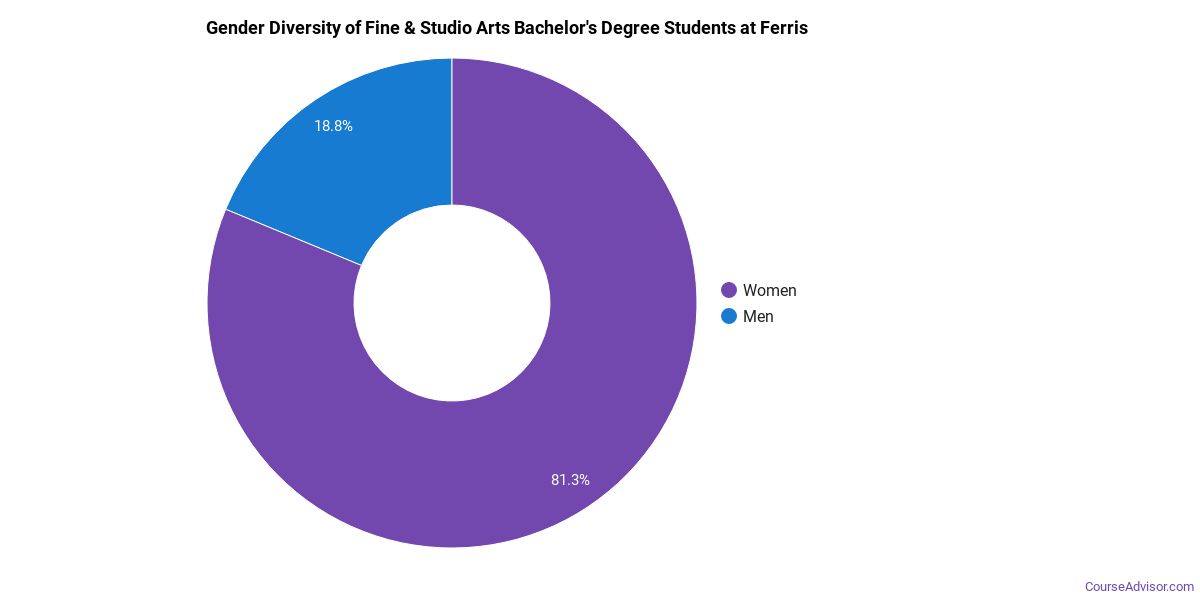
Fine & Studio Arts Bachelor’s Program at Ferris State University
Of the 12 bachelor’s fine & studio arts graduates at Ferris State University, 58% were women (7) and 42% were men (5).
The following table and chart show the race/ethnicity of Fine & Studio Arts bachelor’s degree recipients at Ferris State University.
| Race / Ethnicity | Number of Graduates |
|---|---|
| White | 9 |
| Hispanic / Latino | 2 |
| International (Nonresident) | 1 |
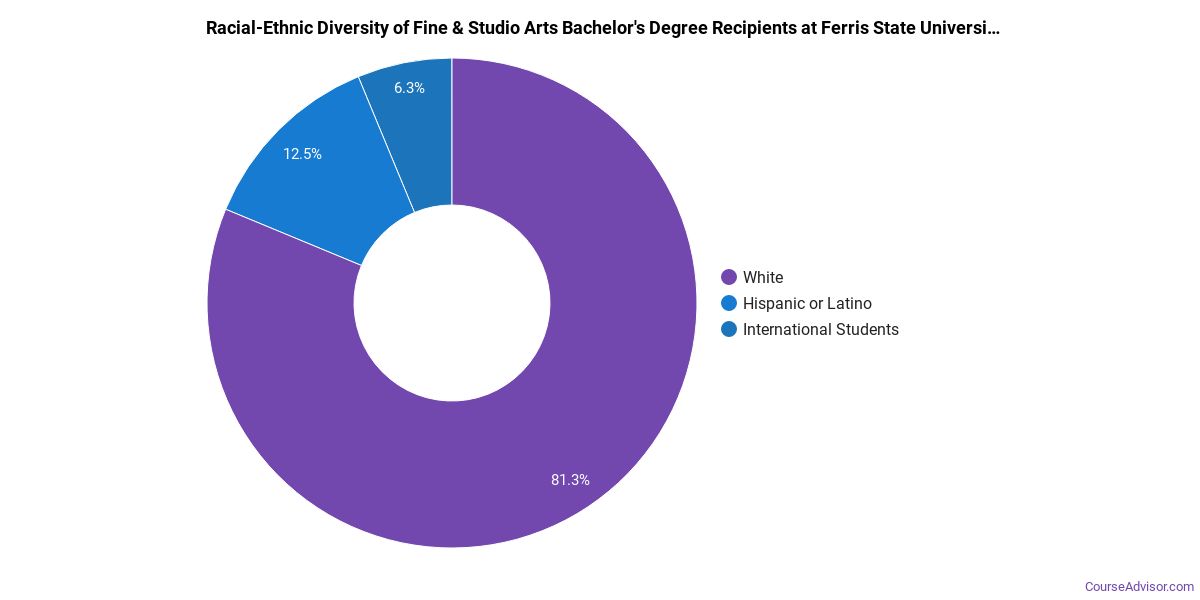
Racial-ethnic minorities make up 17% of Fine & Studio Arts bachelor’s degree recipients at Ferris State University, below the national average of 40%.*
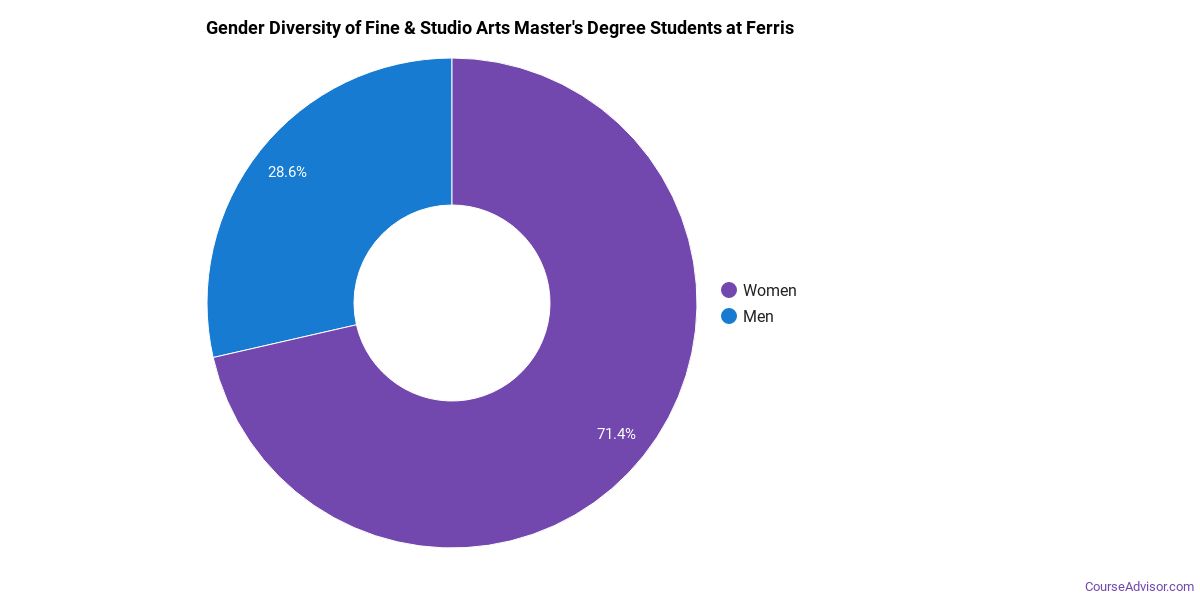
Fine & Studio Arts Master’s Program at Ferris State University
Among the 2 master’s fine & studio arts graduates at Ferris State University, 50% were women (1) and 50% were men (1).
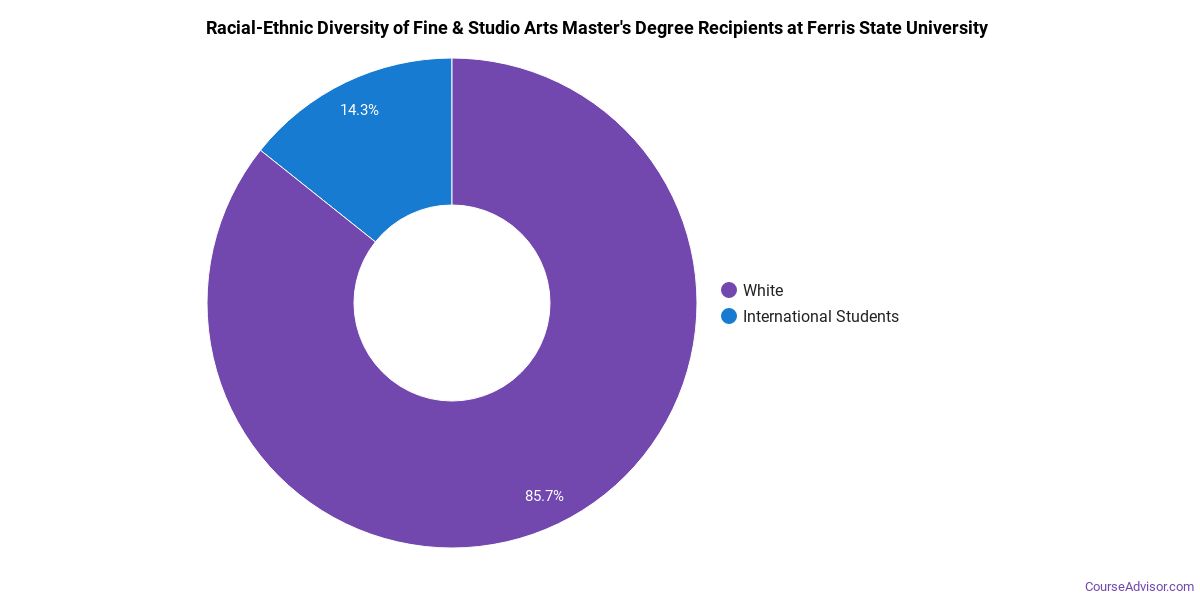
The following table and chart show the race/ethnicity of Fine & Studio Arts master’s degree recipients at Ferris State University.
| Race / Ethnicity | Number of Graduates |
|---|---|
| White | 2 |
*The racial-ethnic minorities figure is the total number of graduates minus White, international (nonresident), and unknown-race graduates.
More Specific Fine & Studio Arts Concentrations at Ferris State University
The Fine & Studio Arts program at Ferris State University includes the following sub-specializations:
| Concentration | Graduates |
|---|---|
| Fine Arts | 12 |
| Art History | 1 |
| Drawing | 2 |
| Painting | 4 |
| Sculpture | 4 |
| Metal & Jewelry Arts | 1 |
Best-Paid Careers for Fine & Studio Arts Graduates
Graduates of the Fine & Studio Arts program at Ferris State University go on to a range of careers. Below are the best-paid careers for Fine & Studio Arts majors, ordered by median annual salary:
| Occupation | Nationwide Median Wage |
|---|---|
| Appraisers of Personal and Business Property | $118,242 |
| Art Directors | $103,285 |
| Museum Technicians and Conservators | $96,273 |
| Artists and Related Workers, All Other | $83,610 |
| Curators | $79,764 |
| Secondary School Teachers, Except Special and Career/Technical Education | $77,927 |
| Craft Artists | $76,826 |
| Photographers | $75,743 |
| Fine Artists, Including Painters, Sculptors, and Illustrators | $69,338 |
| Jewelers and Precious Stone and Metal Workers | $67,147 |
References
- IPEDS — Integrated Postsecondary Education Data System
- U.S. Department of Education — College Scorecard
- O*NET Online (Bureau of Labor Statistics)
- National Center for Education Statistics
More about our data sources and methodologies.
Course Advisor provides higher-education, college and university, degree, program, career, salary, and other helpful information to students, faculty, institutions, and other internet audiences. Presented information and data are subject to change. Inclusion on this website does not imply or represent a direct relationship with the company, school, or brand. Information, though believed correct at time of publication, may not be correct, and no warranty is provided. Contact the schools to verify any information before relying on it. Financial aid may be available for those who qualify. The displayed options may include sponsored or recommended results, not necessarily based on your preferences.
© Course Advisor – All Rights Reserved.