Special Education at Elmhurst University
If you are interested in studying Special Education, take a look at what Elmhurst University. The following information will help you decide if it is a good fit for you.
Elmhurst University is in Elmhurst, IL.
In the most recent year for which we have data, 12 special education degrees were granted at Elmhurst University.
Featured schools near , edit
Online & Distance Learning at Elmhurst University
Many students take online classes at Elmhurst University. Among 3,997 students, 604 (15%) were enrolled entirely in distance education and 1,564 (39%) took at least some classes online.
Special Education Rankings at Elmhurst University
Use these rankings to compare Elmhurst University’s Special Education program to other colleges that offer this major.
Student Demographics & Diversity
The following sections describe the student demographics for Special Education graduates at Elmhurst University, broken down by degree level.
Looking at the program as a whole, Special Education graduates at Elmhurst University are 92% women (11) and 8% men (1).
Special Education Bachelor’s Program at Elmhurst University
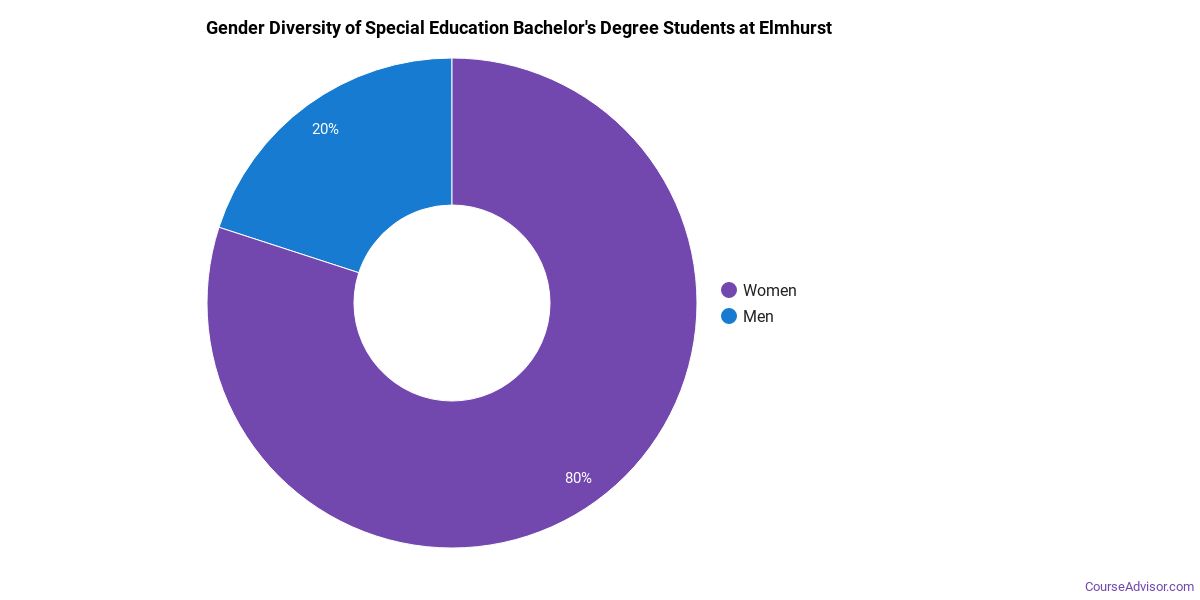
Among the 6 bachelor’s special education graduates at Elmhurst University, 83% were women (5) and 17% were men (1).
The following table and chart show the race/ethnicity of Special Education bachelor’s degree recipients at Elmhurst University.
| Race / Ethnicity | Number of Graduates |
|---|---|
| White | 3 |
| Hispanic / Latino | 2 |
| Asian | 1 |
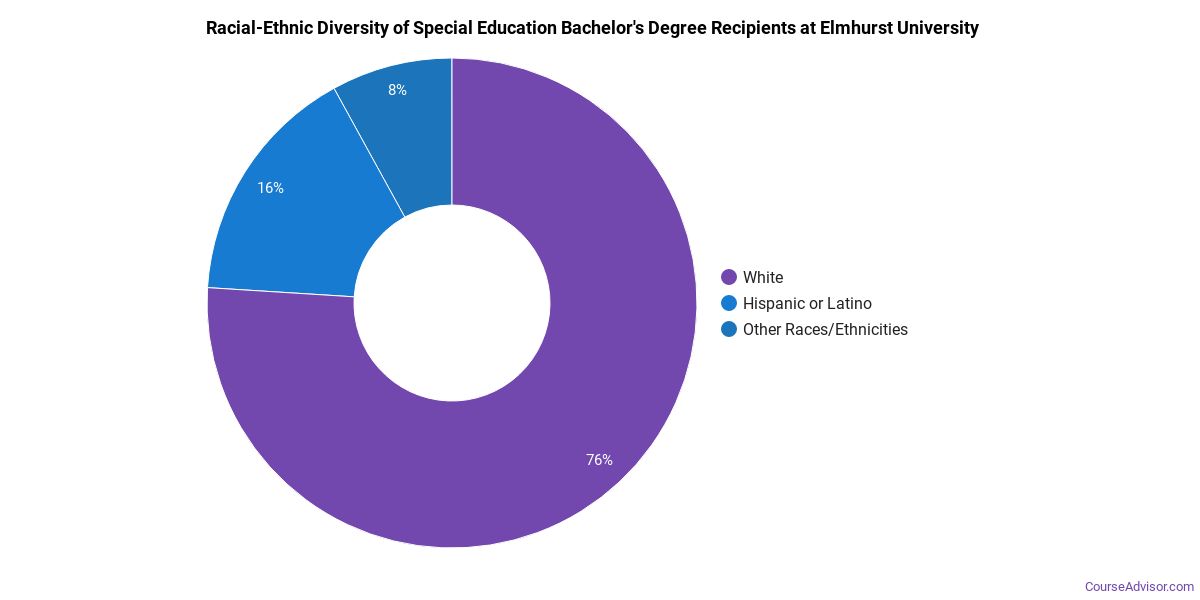
Racial-ethnic minorities make up 50% of Special Education bachelor’s degree recipients at Elmhurst University, above the national average of 20%.*
Special Education Master’s Program at Elmhurst University
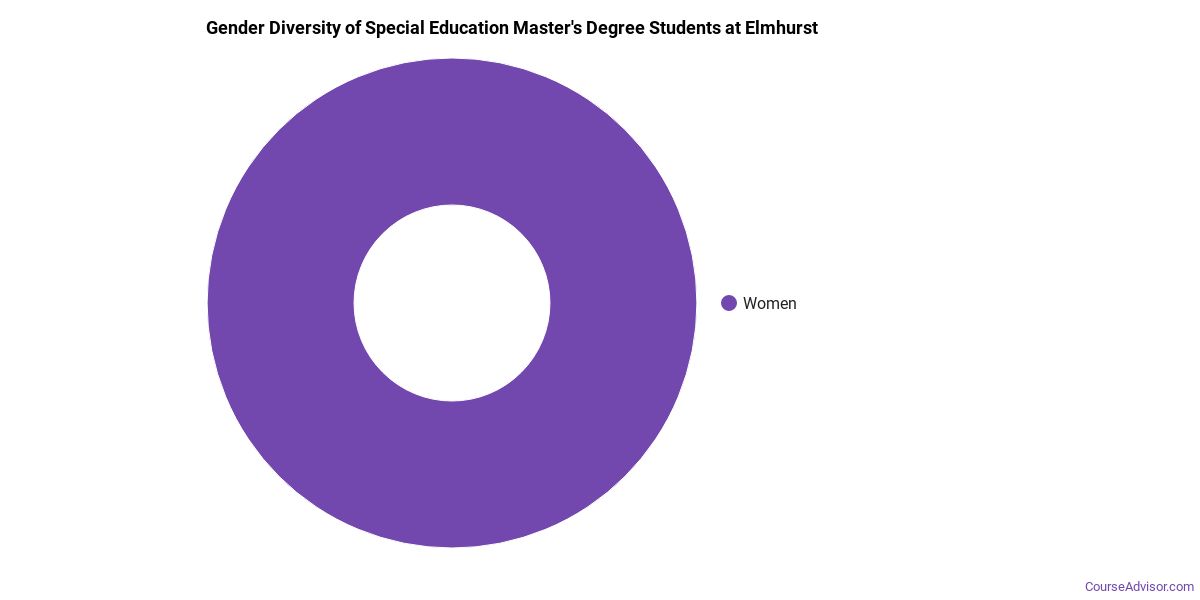
Of the 5 master’s special education degrees awarded at Elmhurst University, 100% were women (5) and 0% were men (0).
The following table and chart show the race/ethnicity of Special Education master’s degree recipients at Elmhurst University.
| Race / Ethnicity | Number of Graduates |
|---|---|
| White | 4 |
| Black / African American | 1 |
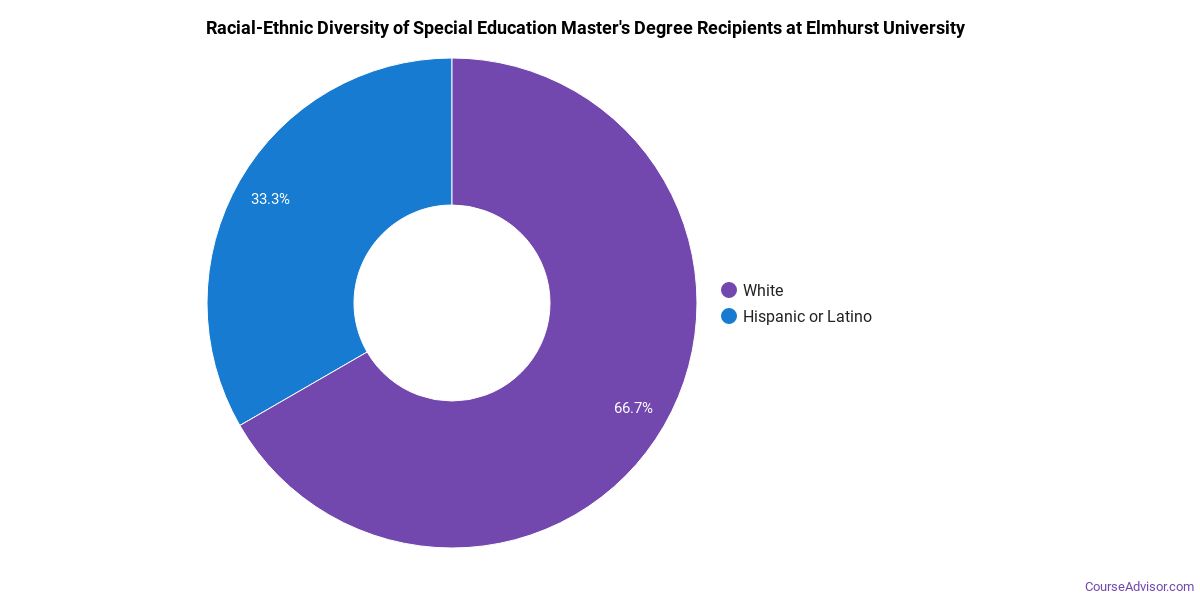
Racial-ethnic minorities make up 20% of Special Education master’s degree recipients at Elmhurst University, lower than the national average of 33%.*
*The racial-ethnic minorities figure is the total number of graduates minus White, international (nonresident), and unknown-race graduates.
More Specific Special Education Concentrations at Elmhurst University
This Special Education program at Elmhurst University breaks down into more specific concentrations:
| Concentration | Graduates |
|---|---|
| General Special Education | 12 |
Best-Paid Careers for Special Education Graduates
Those who complete Special Education program at Elmhurst University work across a variety of fields. Here are the best-paid careers for Special Education graduates, ordered by median annual salary:
| Occupation | Nationwide Median Wage |
|---|---|
| Education Teachers, Postsecondary | $98,329 |
| Teaching Assistants, Special Education | $96,801 |
| Special Education Teachers, All Other | $86,208 |
| Special Education Teachers, Middle School | $80,694 |
| Special Education Teachers, Secondary School | $79,680 |
| Adapted Physical Education Specialists | $77,976 |
| Special Education Teachers, Kindergarten | $73,597 |
| Interpreters and Translators | $52,627 |
| Special Education Teachers, Elementary School | $50,045 |
| Special Education Teachers, Preschool | $35,173 |
References
- IPEDS — Integrated Postsecondary Education Data System
- U.S. Department of Education — College Scorecard
- O*NET Online (Bureau of Labor Statistics)
- National Center for Education Statistics
More about our data sources and methodologies.
Course Advisor provides higher-education, college and university, degree, program, career, salary, and other helpful information to students, faculty, institutions, and other internet audiences. Presented information and data are subject to change. Inclusion on this website does not imply or represent a direct relationship with the company, school, or brand. Information, though believed correct at time of publication, may not be correct, and no warranty is provided. Contact the schools to verify any information before relying on it. Financial aid may be available for those who qualify. The displayed options may include sponsored or recommended results, not necessarily based on your preferences.
© Course Advisor – All Rights Reserved.