Sociology at East Carolina University
What traits are you looking for in a school for Sociology, consider the program at East Carolina University. The following information will help you decide if it is a good fit for you.
East Carolina University is in Greenville, NC.
During the most recent reporting year, 41 sociology graduations were recorded at East Carolina University.
Featured schools near , edit
Online & Distance Learning at East Carolina University
Distance learning is available at East Carolina University. Among 26,940 students, 8,356 (31%) were enrolled entirely in distance education and 11,786 (44%) took at least some classes online.
Sociology Rankings at East Carolina University
These rankings give you a sense of how East Carolina University’s Sociology program against other schools offering the same major.
Bachelor’s-Level Rankings
| Ranking | Scope | Rank |
|---|---|---|
| Best Schools (Quality) | North Carolina | #7 of 15 |
| Best Value | North Carolina | #12 of 15 |
| Best Schools (Quality) | Southeast (Region) | #46 of 108 |
| Best Value | Southeast (Region) | #58 of 108 |
| Best Value | Nationwide | #300 of 543 |
| Best Schools (Quality) | Nationwide | #335 of 543 |
Master’s-Level Rankings
| Ranking | Scope | Rank |
|---|---|---|
| Best Schools (Quality) | North Carolina | #7 of 15 |
| Best Value | North Carolina | #12 of 15 |
| Best Schools (Quality) | Southeast (Region) | #46 of 108 |
| Best Value | Southeast (Region) | #58 of 108 |
| Best Value | Nationwide | #300 of 543 |
| Best Schools (Quality) | Nationwide | #335 of 543 |
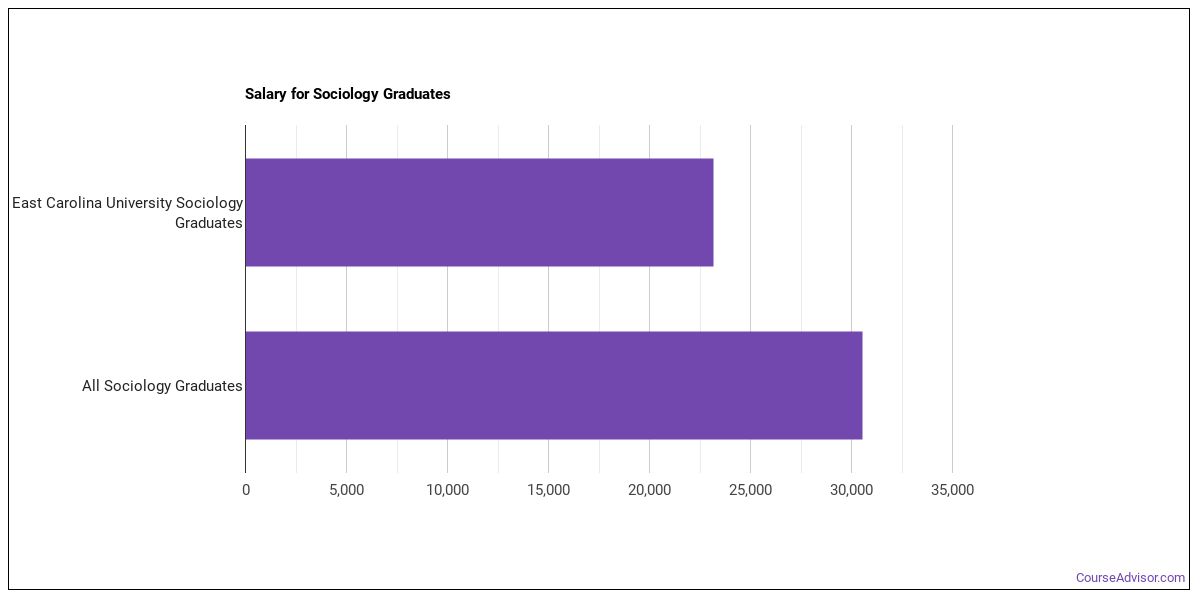
Earnings for Sociology Graduates from East Carolina University
Those who finish East Carolina University’s Sociology program earn at the following median levels (per the U.S. Department of Education’s College Scorecard):
| Years After Graduation | Median Earnings |
|---|---|
| 1 year | $23,164 |
| 2 years | $27,995 |
| 3 years | $31,970 |
| 4 years | $39,917 |
| 5 years | $48,880 |
Is this above or below average for the school? At the four-year mark, Sociology graduates from East Carolina University take home a median $39,917, compared with $61,153 for all East Carolina University graduates — about 35% lower than the school-wide median.

Median Debt at Graduation
The median debt for Sociology graduates from East Carolina University comes in at $25,750.
Student Demographics & Diversity
The following sections describe the composition of Sociology graduates at East Carolina University, by degree type.
Looking at the program as a whole, Sociology graduates at East Carolina University are 98% women (40) and 2% men (1).
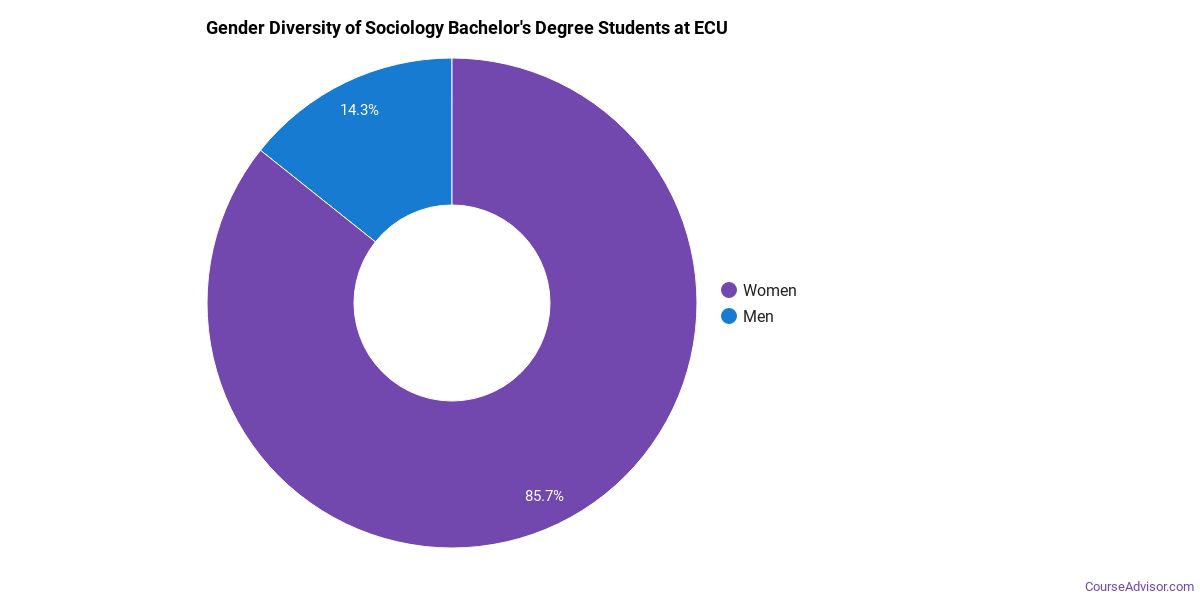
Sociology Bachelor’s Program at East Carolina University
Among the 37 bachelor’s sociology graduates at East Carolina University, 97% were women (36) and 3% were men (1).
The following table and chart show the race/ethnicity of Sociology bachelor’s degree recipients at East Carolina University.
| Race / Ethnicity | Number of Graduates |
|---|---|
| White | 20 |
| Hispanic / Latino | 5 |
| Black / African American | 11 |
| Two or More Races | 1 |
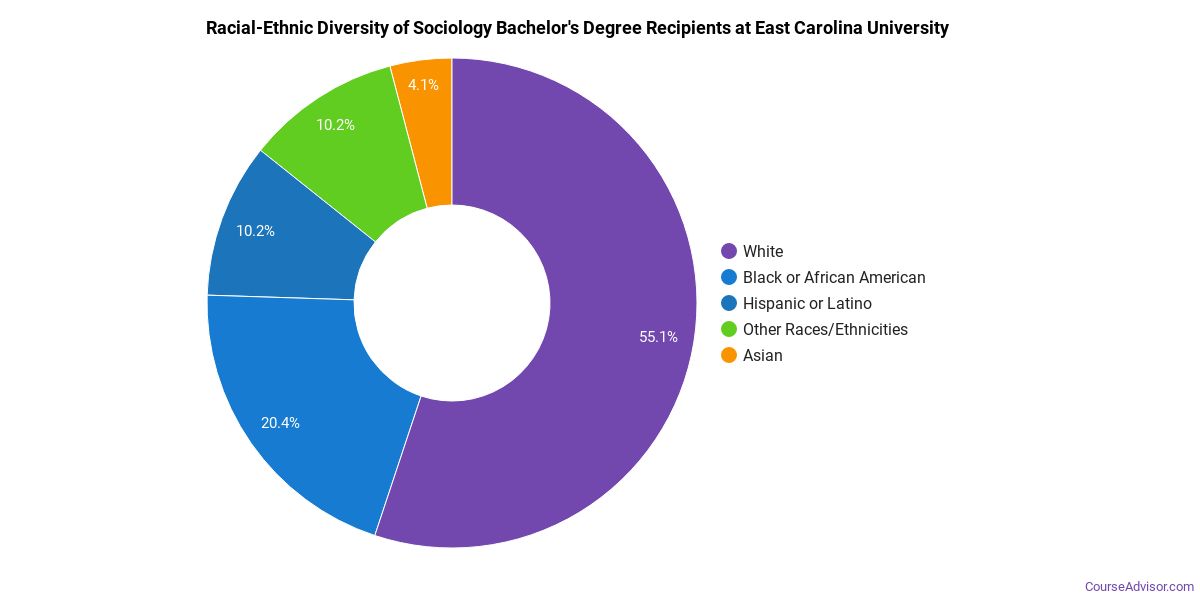
Minority students account for 46% of Sociology bachelor’s degree recipients at East Carolina University, lower than the national average of 56%.*
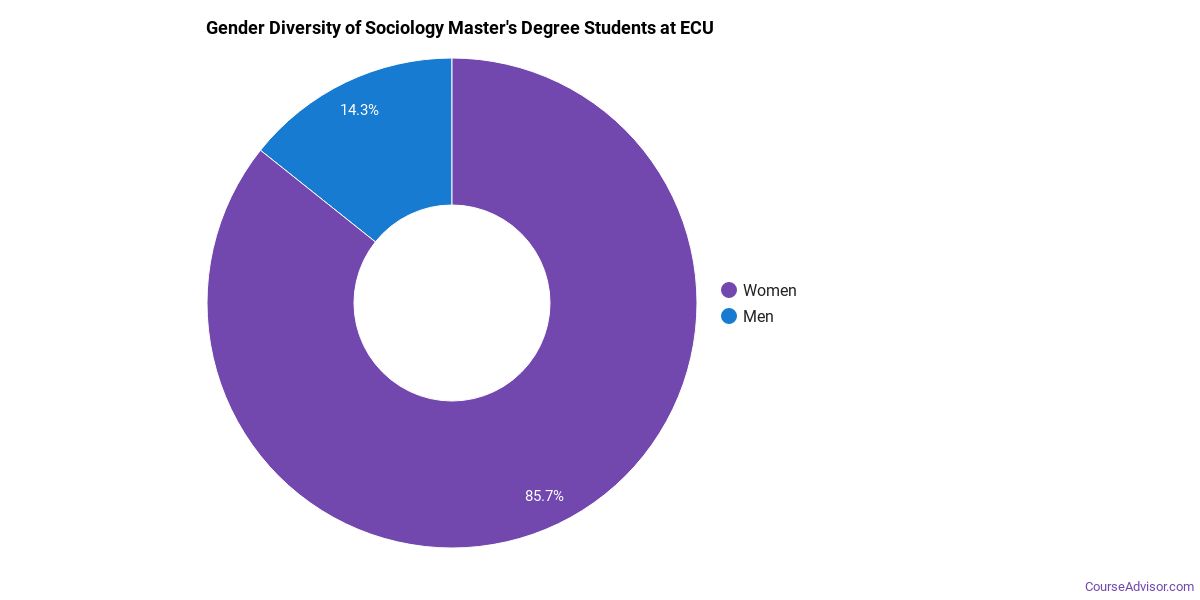
Sociology Master’s Program at East Carolina University
Among the 4 master’s sociology degrees awarded at East Carolina University, 100% were women (4) and 0% were men (0).
The following table and chart show the race/ethnicity of Sociology master’s degree recipients at East Carolina University.
| Race / Ethnicity | Number of Graduates |
|---|---|
| White | 3 |
| Black / African American | 1 |
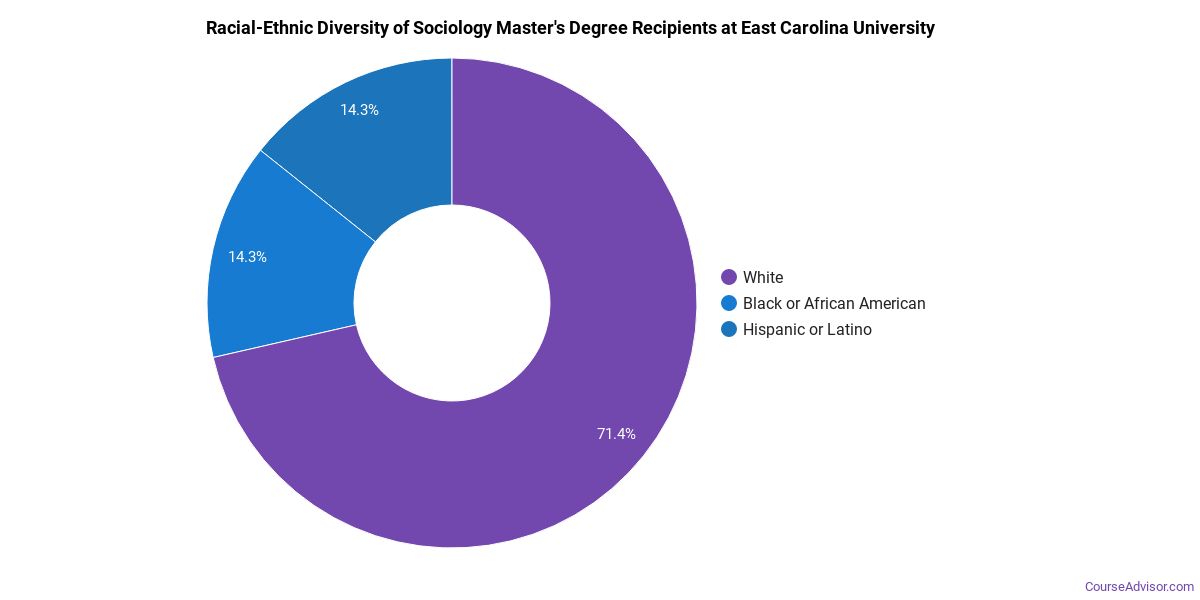
Racial-ethnic minorities make up 25% of Sociology master’s degree recipients at East Carolina University, below the national average of 43%.*
*The racial-ethnic minorities figure is the total number of graduates minus White, international (nonresident), and unknown-race graduates.
More Specific Sociology Concentrations at East Carolina University
This Sociology program at East Carolina University offers more specialized concentrations:
| Concentration | Graduates |
|---|---|
| Sociology | 10 |
| Applied/Public Sociology. | 31 |
Top-Paying Careers for Sociology Graduates
Graduates of the Sociology program at East Carolina University go on to a range of careers. Here are the highest-paying careers for Sociology graduates, ordered by median annual salary:
| Occupation | Nationwide Median Wage |
|---|---|
| Wind Energy Development Managers | $169,952 |
| Loss Prevention Managers | $165,723 |
| Wind Energy Operations Managers | $122,567 |
| Compliance Managers | $117,178 |
| Brownfield Redevelopment Specialists and Site Managers | $99,321 |
| Managers, All Other | $95,684 |
| Regulatory Affairs Managers | $77,828 |
| Sociologists | $74,866 |
| Sociology Teachers, Postsecondary | $53,394 |
| Social Sciences Teachers, Postsecondary, All Other | $47,617 |
References
- IPEDS — Integrated Postsecondary Education Data System
- U.S. Department of Education — College Scorecard
- O*NET Online (Bureau of Labor Statistics)
- National Center for Education Statistics
More about our data sources and methodologies.
Course Advisor provides higher-education, college and university, degree, program, career, salary, and other helpful information to students, faculty, institutions, and other internet audiences. Presented information and data are subject to change. Inclusion on this website does not imply or represent a direct relationship with the company, school, or brand. Information, though believed correct at time of publication, may not be correct, and no warranty is provided. Contact the schools to verify any information before relying on it. Financial aid may be available for those who qualify. The displayed options may include sponsored or recommended results, not necessarily based on your preferences.
© Course Advisor – All Rights Reserved.