Mental & Social Health Services at Davenport University
What traits are you looking for in a school for Mental & Social Health Services, you may want to check out the program at Davenport University. We’ve gathered the following information to help you decide.
Davenport University is located in Grand Rapids, MI.
During the most recent reporting year, 22 mental & social health services degrees were awarded at Davenport University.
Featured schools near , edit
Studying Online at Davenport University
Distance learning is available at Davenport University. Among 4,815 students, 2,536 (53%) studied exclusively online and 1,339 (28%) took at least some classes online.
Mental & Social Health Services Rankings at Davenport University
Use these rankings to compare Davenport University’s Mental & Social Health Services program against peer institutions.
Bachelor’s-Level Rankings
| Ranking | Scope | Rank |
|---|---|---|
| Best Schools (Quality) | Michigan | #9 of 10 |
| Best Value | Michigan | #9 of 10 |
| Best Value | Great Lakes (Region) | #57 of 80 |
| Best Schools (Quality) | Great Lakes (Region) | #65 of 81 |
| Best Value | Nationwide | #349 of 514 |
| Best Schools (Quality) | Nationwide | #423 of 530 |
Median Debt at Graduation
The median debt for Mental & Social Health Services graduates from Davenport University comes in at $27,000.
Student Demographics & Diversity
The following sections describe the diversity of Mental & Social Health Services graduates at Davenport University, broken down by degree level.
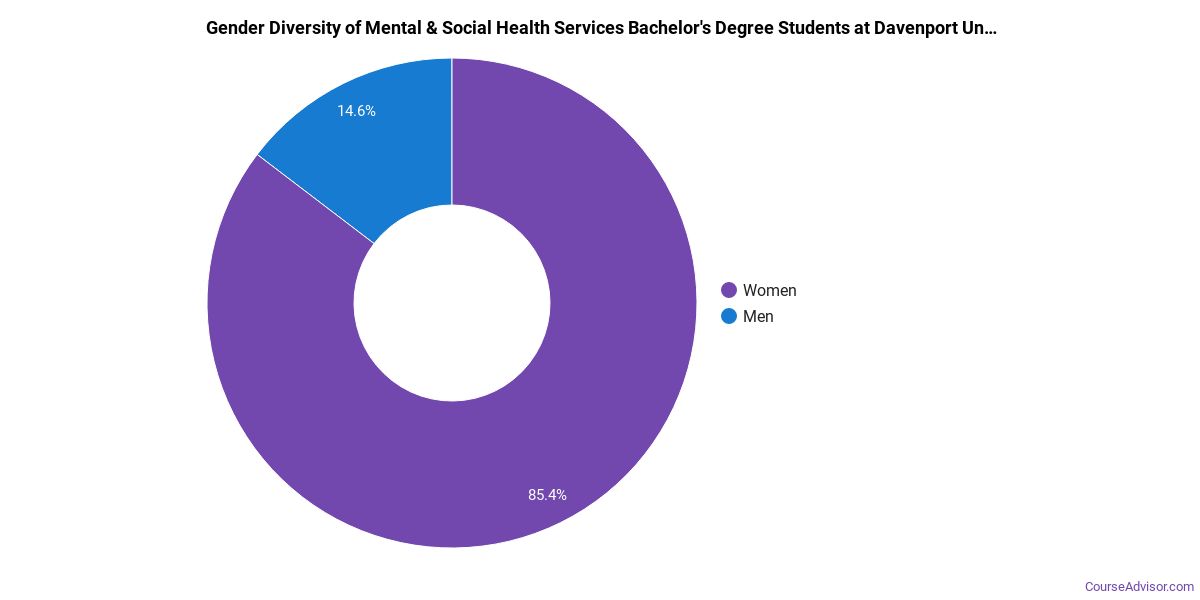
Program-wide, Mental & Social Health Services graduates at Davenport University are 82% women (18) and 18% men (4).
Mental & Social Health Services Bachelor’s Program at Davenport University
Among the 21 bachelor’s mental & social health services degrees awarded at Davenport University, 81% were women (17) and 19% were men (4).
The following table and chart show the race/ethnicity of Mental & Social Health Services bachelor’s degree recipients at Davenport University.
| Race / Ethnicity | Number of Graduates |
|---|---|
| White | 14 |
| Hispanic / Latino | 2 |
| Black / African American | 1 |
| Two or More Races | 2 |
| International (Nonresident) | 2 |
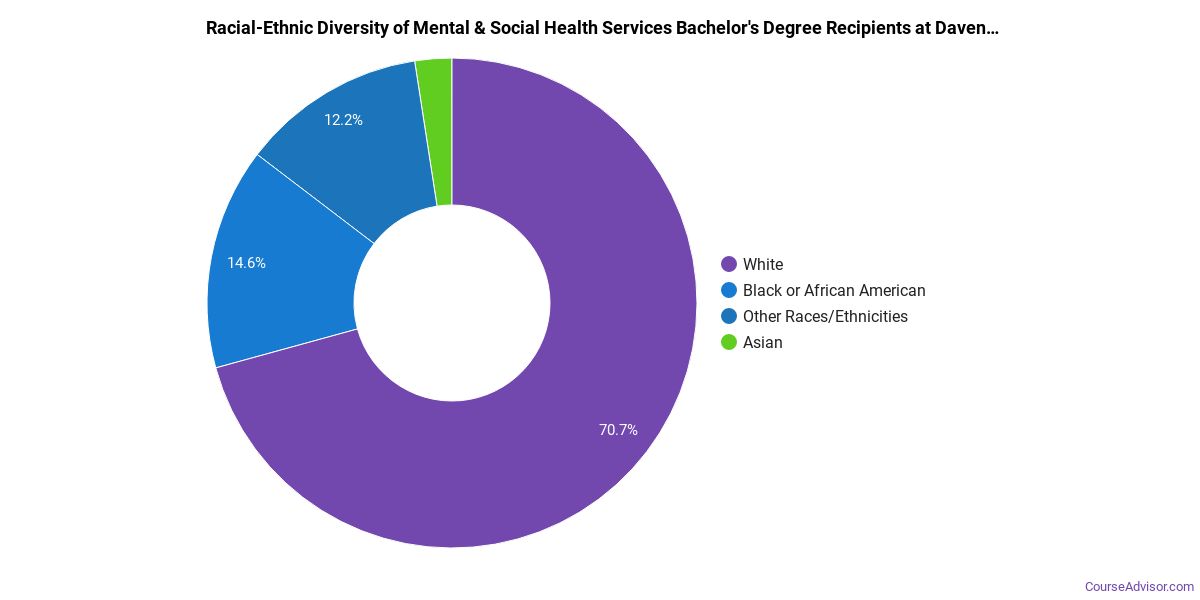
Racial-ethnic minorities make up 24% of Mental & Social Health Services bachelor’s degree recipients at Davenport University, below the national average of 41%.*
*The racial-ethnic minorities figure is the total number of graduates minus White, international (nonresident), and unknown-race graduates.
More Specific Mental & Social Health Services Concentrations at Davenport University
The Mental & Social Health Services program at Davenport University offers more specialized concentrations:
| Concentration | Graduates |
|---|---|
| Community Health Services/Counseling | 22 |
Highest-Paying Careers for Mental & Social Health Services Graduates
Graduates of the Mental & Social Health Services program at Davenport University pursue many career paths. Below are the highest-paying careers for Mental & Social Health Services majors, ordered by median annual salary:
| Occupation | Nationwide Median Wage |
|---|---|
| Psychology Teachers, Postsecondary | $98,479 |
| Counselors, All Other | $81,766 |
| Health Education Specialists | $81,726 |
| Healthcare Social Workers | $78,044 |
| Marriage and Family Therapists | $74,325 |
| Community Health Workers | $73,901 |
| Mental Health Counselors | $72,983 |
| Clinical and Counseling Psychologists | $68,140 |
| Social Work Teachers, Postsecondary | $65,510 |
| Directors, Religious Activities and Education | $64,599 |
References
- IPEDS — Integrated Postsecondary Education Data System
- U.S. Department of Education — College Scorecard
- O*NET Online (Bureau of Labor Statistics)
- National Center for Education Statistics
More about our data sources and methodologies.
Course Advisor provides higher-education, college and university, degree, program, career, salary, and other helpful information to students, faculty, institutions, and other internet audiences. Presented information and data are subject to change. Inclusion on this website does not imply or represent a direct relationship with the company, school, or brand. Information, though believed correct at time of publication, may not be correct, and no warranty is provided. Contact the schools to verify any information before relying on it. Financial aid may be available for those who qualify. The displayed options may include sponsored or recommended results, not necessarily based on your preferences.
© Course Advisor – All Rights Reserved.