Music at Converse University
What traits are you looking for in a school for Music, consider the program at Converse University. Get started with the following essential facts.
Converse University is located in Spartanburg, SC.
In the most recent year for which we have data, 13 music degrees were awarded at Converse University.
Featured schools near , edit
Online Class Availability at Converse University
Online coursework is an option at Converse University. Among 1,787 students, 161 (9%) were enrolled entirely in distance education and 545 (30%) took at least some classes online.
Music Rankings at Converse University
Rankings can help you compare Converse University’s Music program to other colleges that offer this major.
Student Demographics & Diversity
Take a look at the student demographics for Music graduates at Converse University, by degree type.
Looking at the program as a whole, Music graduates at Converse University are 62% women (8) and 38% men (5).
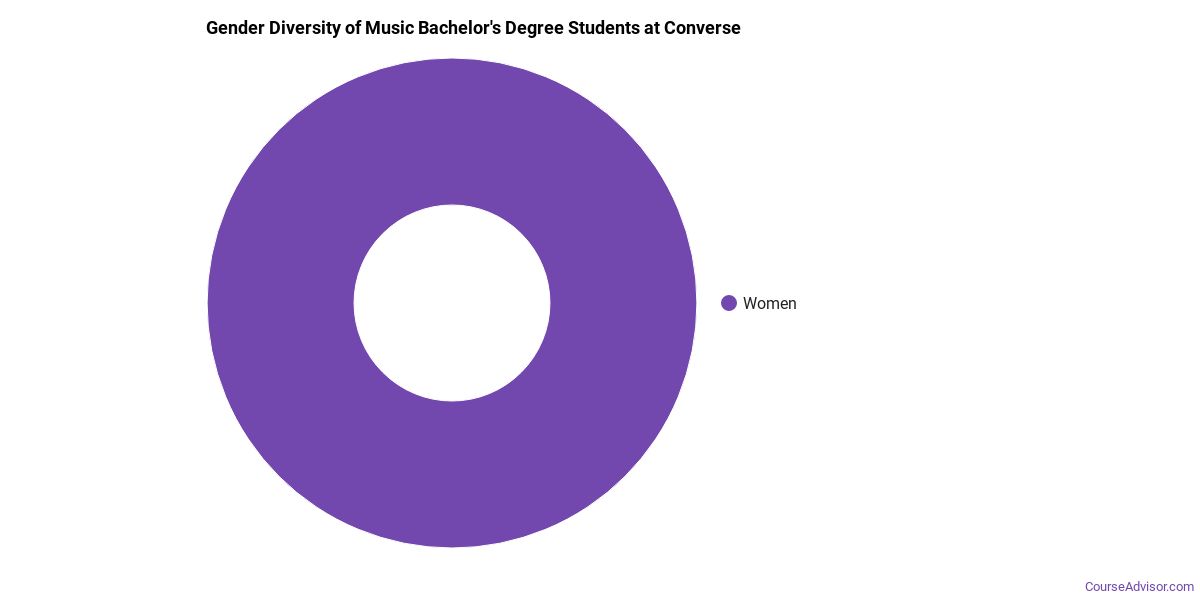
Music Bachelor’s Program at Converse University
Among the 8 bachelor’s music graduates at Converse University, 62% were women (5) and 38% were men (3).
The following table and chart show the race/ethnicity of Music bachelor’s degree recipients at Converse University.
| Race / Ethnicity | Number of Graduates |
|---|---|
| White | 6 |
| Asian | 2 |
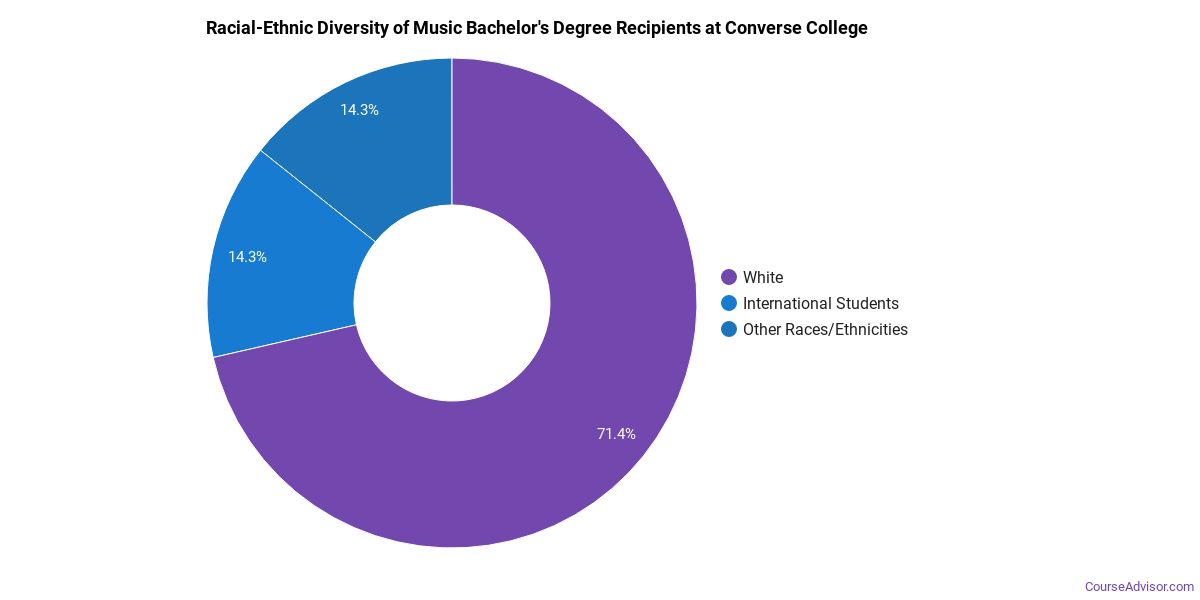
Minority students account for 25% of Music bachelor’s degree recipients at Converse University, below the national average of 34%.*
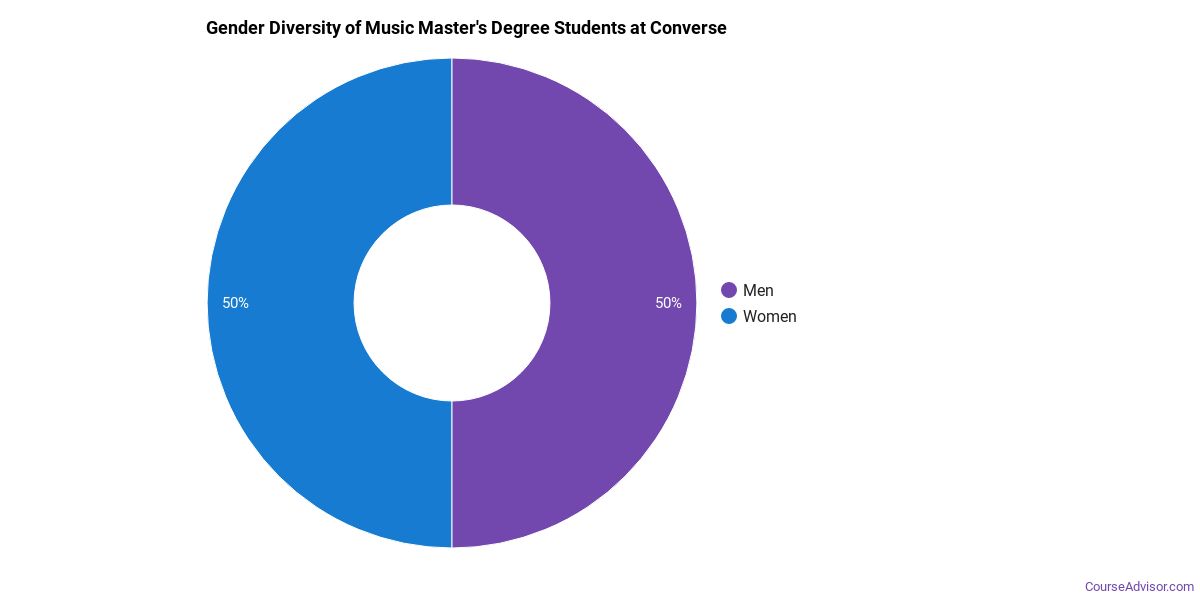
Music Master’s Program at Converse University
Of the 5 master’s music graduates at Converse University, 60% were women (3) and 40% were men (2).
The following table and chart show the race/ethnicity of Music master’s degree recipients at Converse University.
| Race / Ethnicity | Number of Graduates |
|---|---|
| White | 5 |

*The racial-ethnic minorities figure is the total number of graduates minus White, international (nonresident), and unknown-race graduates.
More Specific Music Concentrations at Converse University
The Music program at Converse University offers more specialized concentrations:
| Concentration | Graduates |
|---|---|
| General Music | 2 |
| Music Performance | 9 |
| Music Theory & Composition | 2 |
Top-Paying Careers for Music Graduates
Students who finish Music program at Converse University work across a variety of fields. The table below ranks the top-paying careers for Music graduates, ordered by median annual salary:
| Occupation | Nationwide Median Wage |
|---|---|
| Musicians and Singers | $96,571 |
| Disc Jockeys, Except Radio | $87,328 |
| Secondary School Teachers, Except Special and Career/Technical Education | $77,927 |
| Music Directors and Composers | $66,915 |
| Sound Engineering Technicians | $66,427 |
| Art, Drama, and Music Teachers, Postsecondary | $46,983 |
References
- IPEDS — Integrated Postsecondary Education Data System
- U.S. Department of Education — College Scorecard
- O*NET Online (Bureau of Labor Statistics)
- National Center for Education Statistics
More about our data sources and methodologies.
Course Advisor provides higher-education, college and university, degree, program, career, salary, and other helpful information to students, faculty, institutions, and other internet audiences. Presented information and data are subject to change. Inclusion on this website does not imply or represent a direct relationship with the company, school, or brand. Information, though believed correct at time of publication, may not be correct, and no warranty is provided. Contact the schools to verify any information before relying on it. Financial aid may be available for those who qualify. The displayed options may include sponsored or recommended results, not necessarily based on your preferences.
© Course Advisor – All Rights Reserved.