Peace Studies & Conflict Resolution at Chapman University
If you plan to study Peace Studies & Conflict Resolution, consider the program at Chapman University. We’ve gathered the following information to help you decide.
Chapman University is located in Orange, CA.
During the most recent reporting year, 18 peace studies & conflict resolution degrees were awarded at Chapman University.
Featured schools near , edit
Online & Distance Learning at Chapman University
Many students take online classes at Chapman University. Of 9,760 students, 1 (0%) studied exclusively online and 71 (1%) took at least some classes online.
Student Demographics & Diversity
The following sections describe the composition of Peace Studies & Conflict Resolution graduates at Chapman University, by degree type.
Program-wide, Peace Studies & Conflict Resolution graduates at Chapman University are 72% women (13) and 28% men (5).
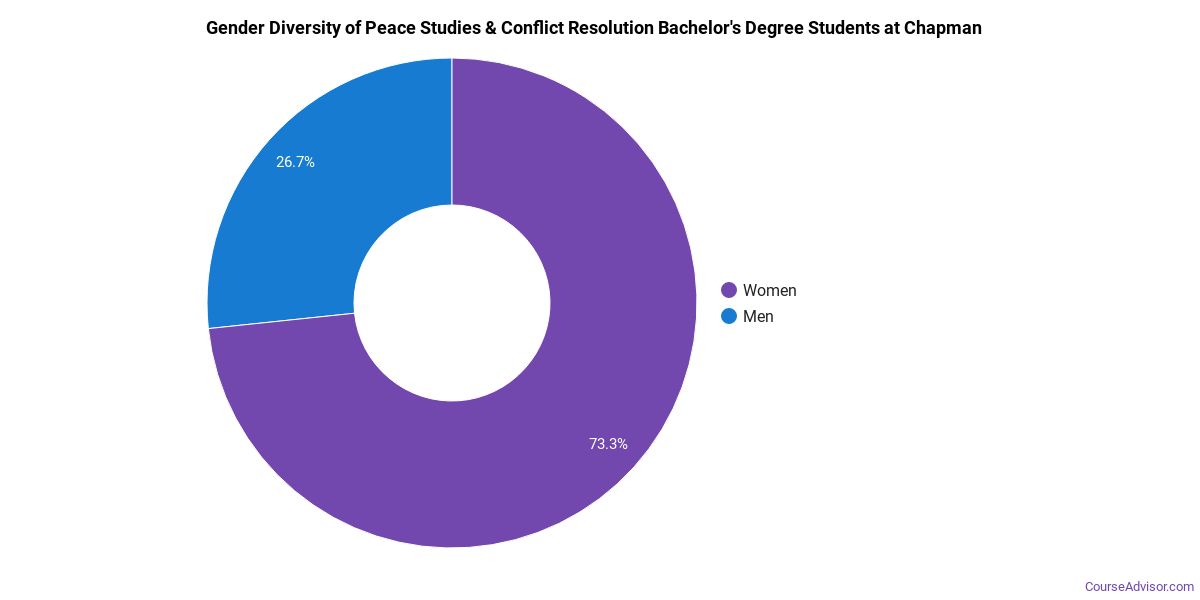
Peace Studies & Conflict Resolution Bachelor’s Program at Chapman University
Of the 12 bachelor’s peace studies & conflict resolution degrees awarded at Chapman University, 92% were women (11) and 8% were men (1).
The following table and chart show the race/ethnicity of Peace Studies & Conflict Resolution bachelor’s degree recipients at Chapman University.
| Race / Ethnicity | Number of Graduates |
|---|---|
| White | 4 |
| Hispanic / Latino | 4 |
| Asian | 2 |
| Two or More Races | 2 |
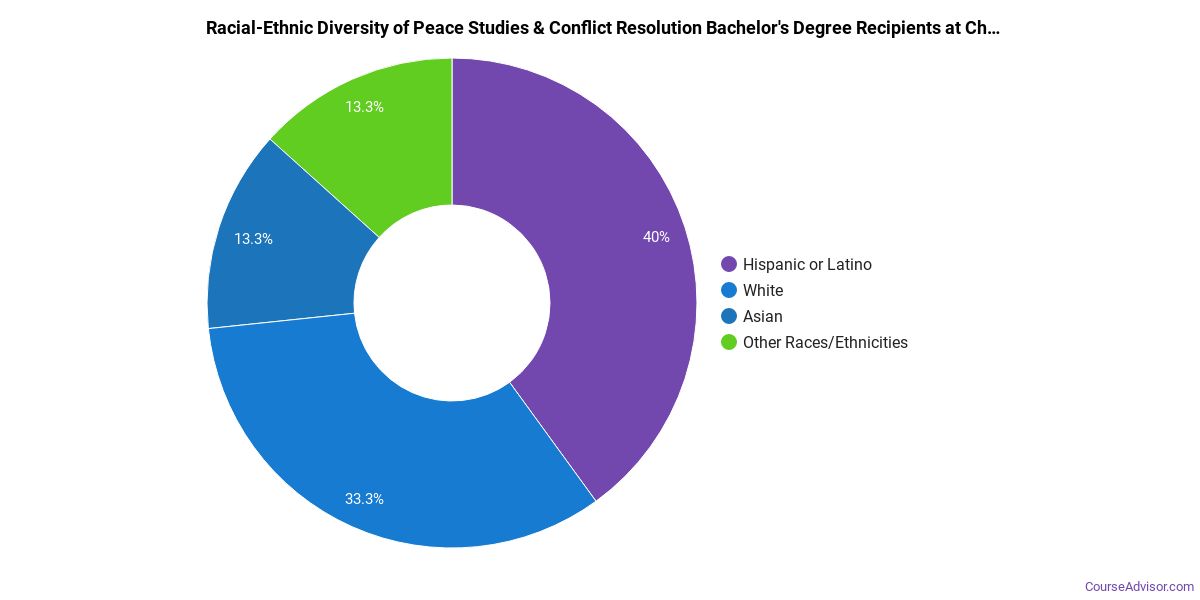
Racial-ethnic minorities make up 67% of Peace Studies & Conflict Resolution bachelor’s degree recipients at Chapman University, above the national average of 35%.*
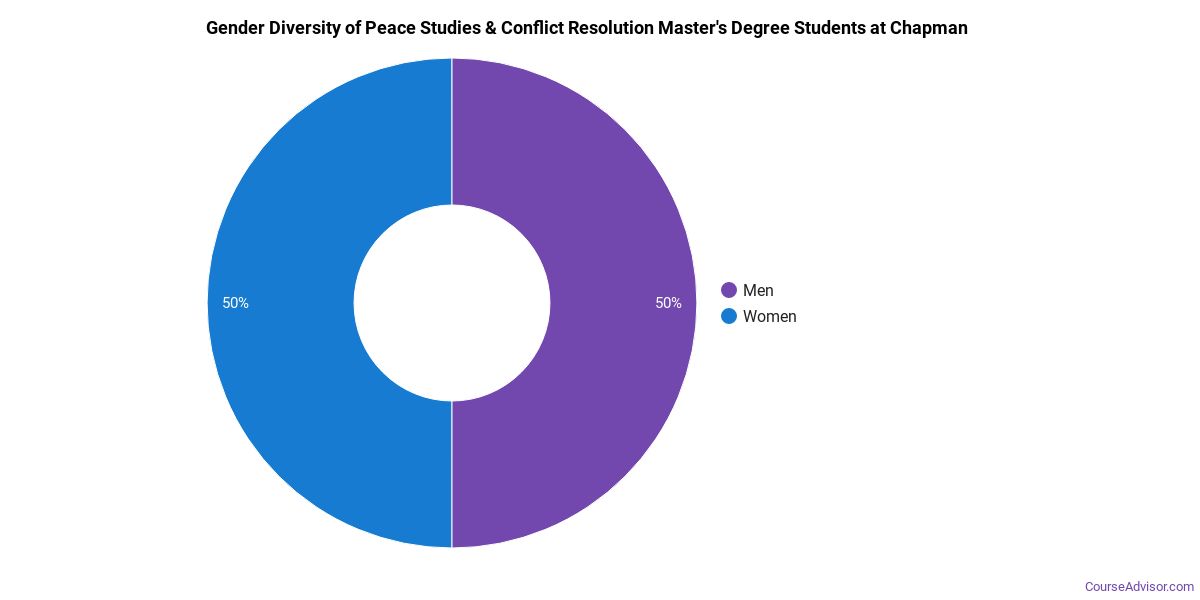
Peace Studies & Conflict Resolution Master’s Program at Chapman University
Among the 6 master’s peace studies & conflict resolution degrees awarded at Chapman University, 33% were women (2) and 67% were men (4).
The following table and chart show the race/ethnicity of Peace Studies & Conflict Resolution master’s degree recipients at Chapman University.
| Race / Ethnicity | Number of Graduates |
|---|---|
| White | 4 |
| Black / African American | 1 |
| Unknown | 1 |
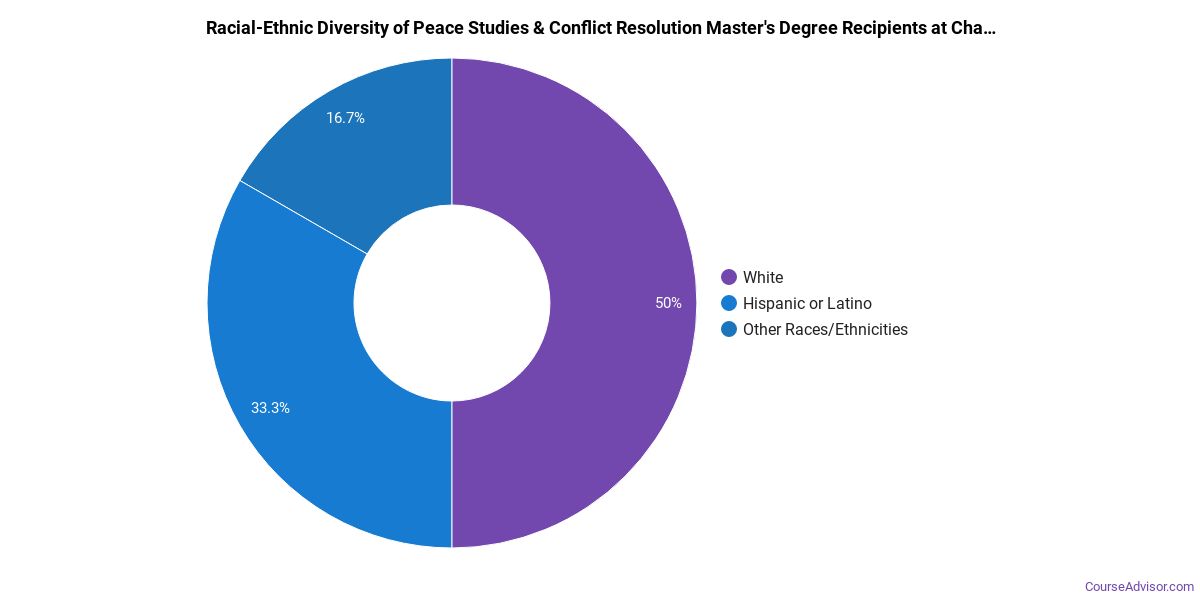
Minority students account for 17% of Peace Studies & Conflict Resolution master’s degree recipients at Chapman University, below the national average of 30%.*
*The racial-ethnic minorities figure is the total number of graduates minus White, international (nonresident), and unknown-race graduates.
More Specific Peace Studies & Conflict Resolution Concentrations at Chapman University
The Peace Studies & Conflict Resolution program at Chapman University breaks down into more specific concentrations:
| Concentration | Graduates |
|---|---|
| Peace Studies & Conflict Resolution | 18 |
Top-Paying Careers for Peace Studies & Conflict Resolution Graduates
Students who finish Peace Studies & Conflict Resolution program at Chapman University work across a variety of fields. The table below ranks the best-paid careers for Peace Studies & Conflict Resolution graduates, ordered by median annual salary:
| Occupation | Nationwide Median Wage |
|---|---|
| Arbitrators, Mediators, and Conciliators | $93,794 |
| Postsecondary Teachers, All Other | $68,967 |
| Transportation Planners | $50,855 |
| Social Scientists and Related Workers, All Other | $42,168 |
References
- IPEDS — Integrated Postsecondary Education Data System
- U.S. Department of Education — College Scorecard
- O*NET Online (Bureau of Labor Statistics)
- National Center for Education Statistics
More about our data sources and methodologies.
Course Advisor provides higher-education, college and university, degree, program, career, salary, and other helpful information to students, faculty, institutions, and other internet audiences. Presented information and data are subject to change. Inclusion on this website does not imply or represent a direct relationship with the company, school, or brand. Information, though believed correct at time of publication, may not be correct, and no warranty is provided. Contact the schools to verify any information before relying on it. Financial aid may be available for those who qualify. The displayed options may include sponsored or recommended results, not necessarily based on your preferences.
© Course Advisor – All Rights Reserved.