Chemistry at Central Washington University
If you plan to study Chemistry, take a look at what Central Washington University. We’ve gathered the following information to help you decide.
Central Washington University is in Ellensburg, WA.
In the most recent year for which we have data, 22 chemistry graduations were recorded at Central Washington University.
Featured schools near , edit
Online Class Availability at Central Washington University
Many students take online classes at Central Washington University. Among 10,811 students, 2,377 (22%) studied exclusively online and 3,856 (36%) took at least some classes online.
Chemistry Rankings at Central Washington University
These rankings give you a sense of how Central Washington University’s Chemistry program to other colleges that offer this major.
Bachelor’s-Level Rankings
| Ranking | Scope | Rank |
|---|---|---|
| Best Value | Washington | #5 of 7 |
| Best Schools (Quality) | Washington | #6 of 7 |
| Best Value | Far Western (Region) | #50 of 66 |
| Best Schools (Quality) | Far Western (Region) | #59 of 66 |
| Best Value | Nationwide | #163 of 389 |
| Best Schools (Quality) | Nationwide | #307 of 390 |
Master’s-Level Rankings
| Ranking | Scope | Rank |
|---|---|---|
| Best Value | Washington | #5 of 7 |
| Best Schools (Quality) | Washington | #6 of 7 |
| Best Value | Far Western (Region) | #50 of 66 |
| Best Schools (Quality) | Far Western (Region) | #59 of 66 |
| Best Value | Nationwide | #163 of 389 |
| Best Schools (Quality) | Nationwide | #307 of 390 |
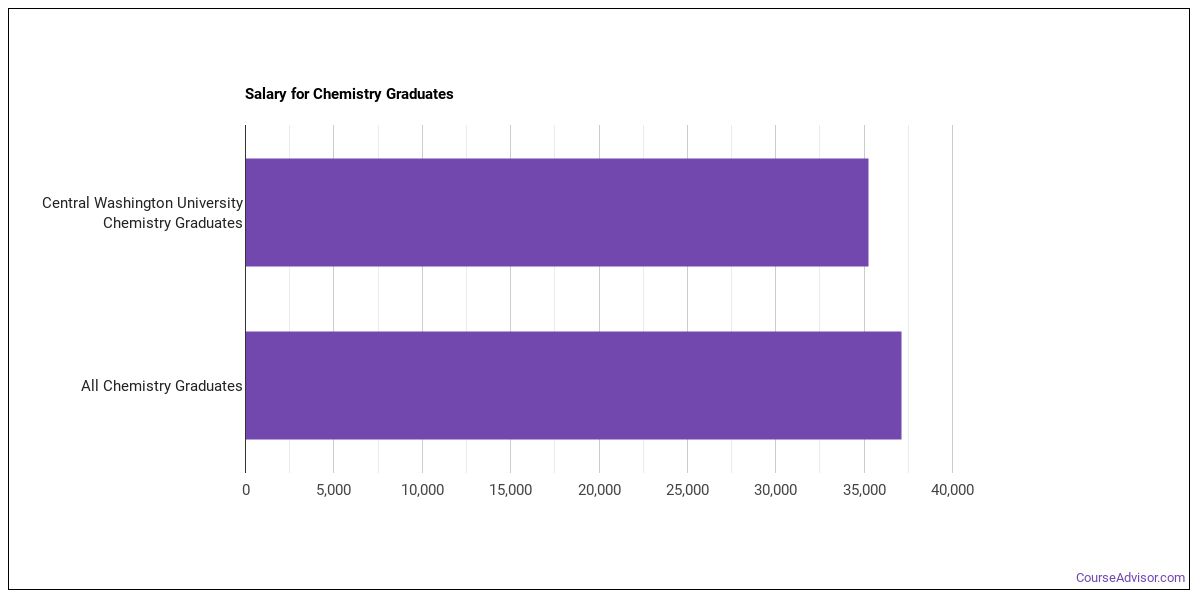
Earnings for Chemistry Graduates from Central Washington University
Those who finish Central Washington University’s Chemistry program earn at the following median levels (per the U.S. Department of Education’s College Scorecard):
| Years After Graduation | Median Earnings |
|---|---|
| 1 year | $35,240 |
| 2 years | $37,208 |
| 3 years | $44,597 |
| 4 years | $49,468 |
| 5 years | $60,029 |
How do these earnings stack up against the rest of the school? Four years after graduating, Chemistry graduates from Central Washington University report median earnings of $49,468, compared with $54,307 for all Central Washington University graduates — about 9% lower than the school-wide median.

Median Debt at Graduation
Typical debt at graduation for Chemistry graduates from Central Washington University is $24,607.
Student Demographics & Diversity
The following sections describe the student demographics for Chemistry graduates at Central Washington University, broken down by degree level.
Program-wide, Chemistry graduates at Central Washington University are 50% women (11) and 50% men (11).
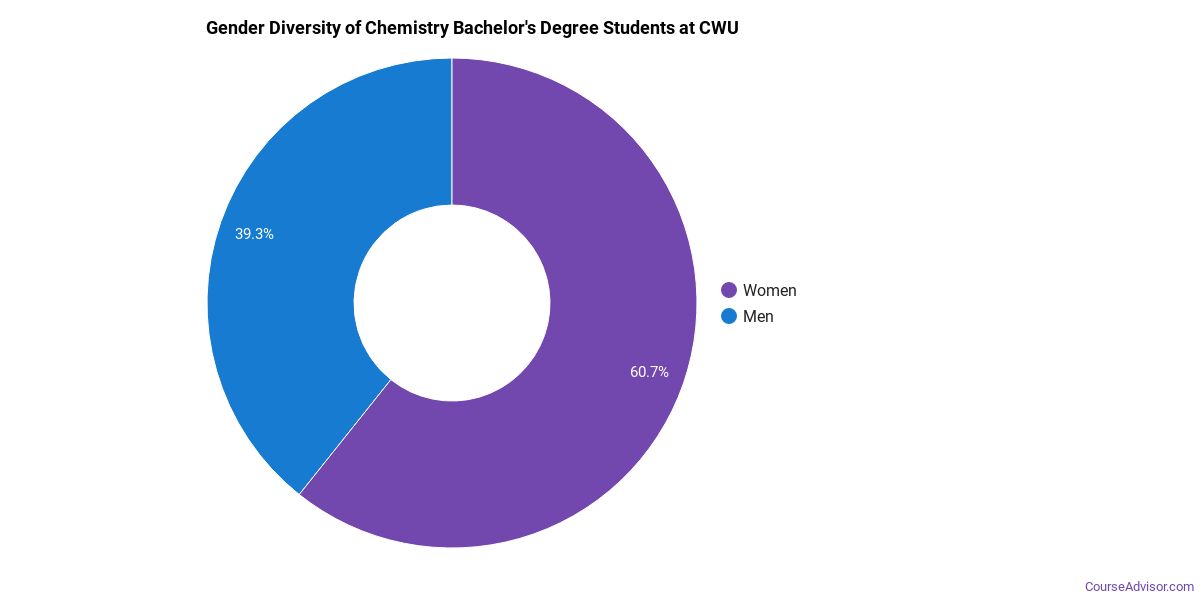
Chemistry Bachelor’s Program at Central Washington University
Of the 18 bachelor’s chemistry degrees awarded at Central Washington University, 50% were women (9) and 50% were men (9).
The following table and chart show the race/ethnicity of Chemistry bachelor’s degree recipients at Central Washington University.
| Race / Ethnicity | Number of Graduates |
|---|---|
| White | 13 |
| Hispanic / Latino | 2 |
| International (Nonresident) | 2 |
| Unknown | 1 |
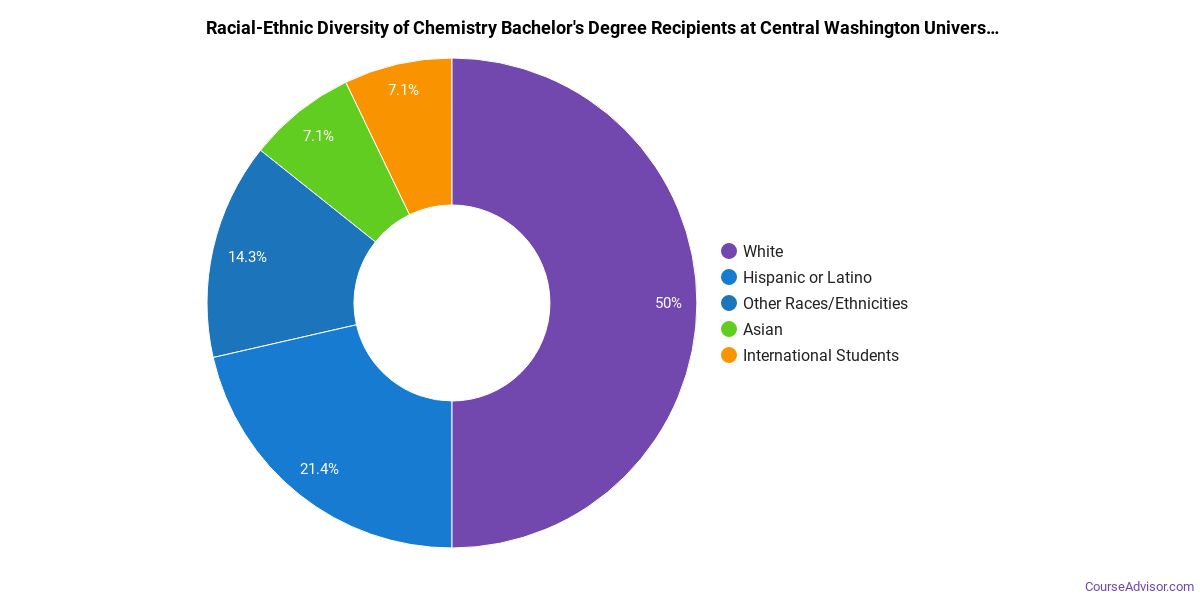
Minority students account for 11% of Chemistry bachelor’s degree recipients at Central Washington University, below the national average of 40%.*
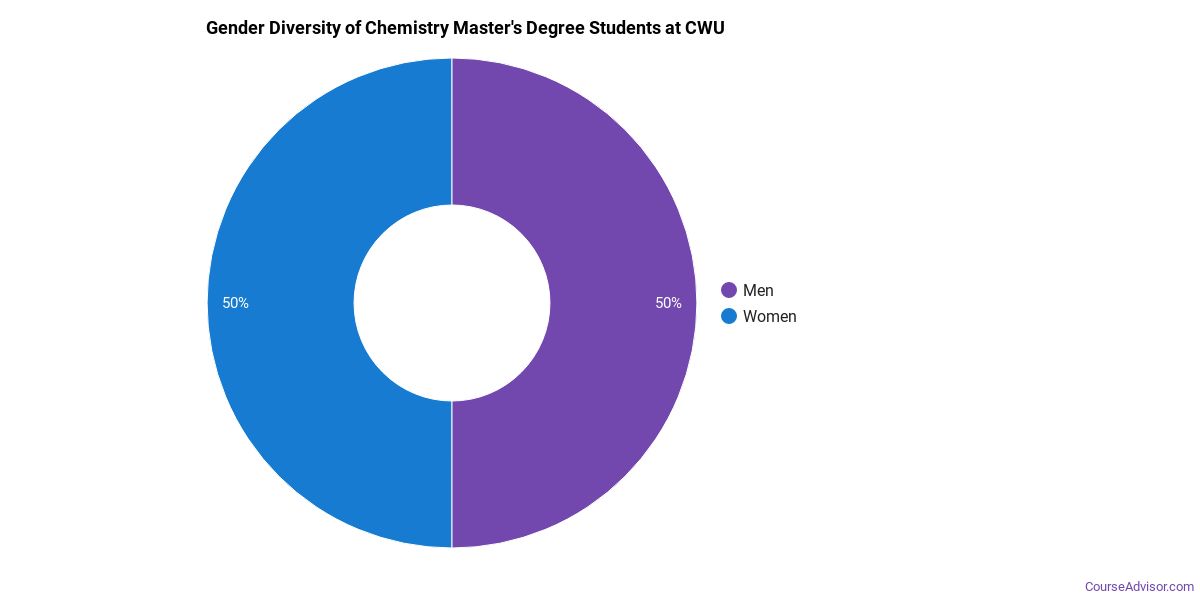
Chemistry Master’s Program at Central Washington University
Of the 4 master’s chemistry graduates at Central Washington University, 50% were women (2) and 50% were men (2).
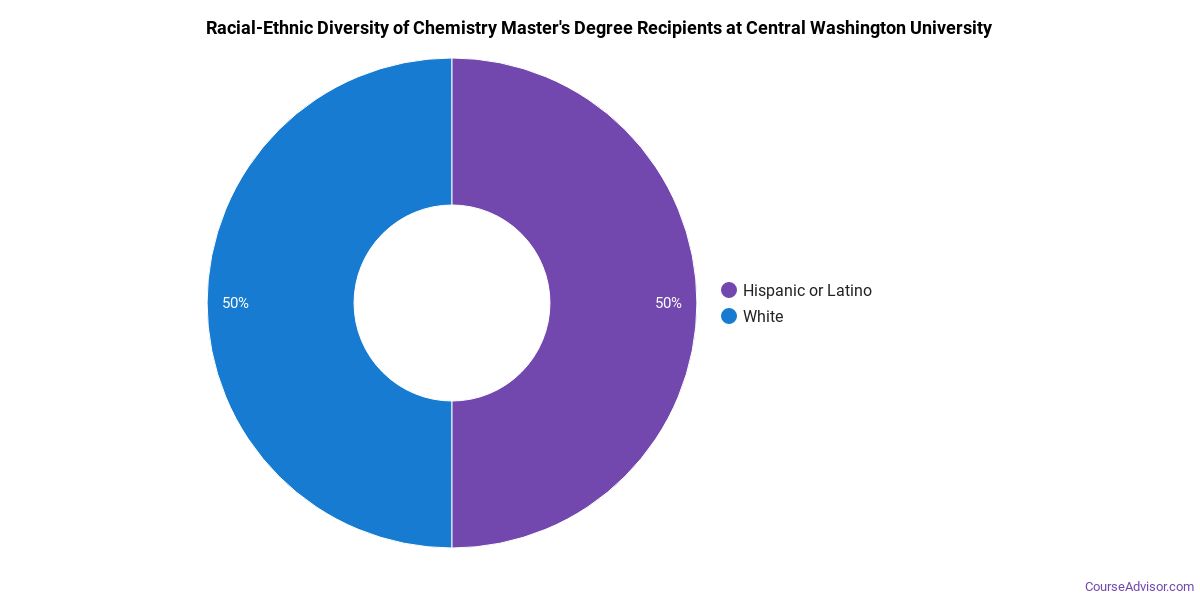
The following table and chart show the race/ethnicity of Chemistry master’s degree recipients at Central Washington University.
| Race / Ethnicity | Number of Graduates |
|---|---|
| White | 1 |
| International (Nonresident) | 3 |
*The racial-ethnic minorities figure is the total number of graduates minus White, international (nonresident), and unknown-race graduates.
More Specific Chemistry Concentrations at Central Washington University
The Chemistry program at Central Washington University includes the following sub-specializations:
| Concentration | Graduates |
|---|---|
| General Chemistry | 22 |
Top-Paying Careers for Chemistry Graduates
Graduates of the Chemistry program at Central Washington University pursue many career paths. Here are the highest-paying careers for Chemistry majors, ordered by median annual salary:
| Occupation | Nationwide Median Wage |
|---|---|
| Water Resource Specialists | $179,716 |
| Computer Occupations, All Other | $159,837 |
| Document Management Specialists | $147,490 |
| Business Intelligence Analysts | $143,840 |
| Information Security Engineers | $142,543 |
| Computer Systems Engineers/Architects | $140,795 |
| Natural Sciences Managers | $132,227 |
| Information Technology Project Managers | $124,655 |
| Blockchain Engineers | $123,667 |
| Digital Forensics Analysts | $119,226 |
References
- IPEDS — Integrated Postsecondary Education Data System
- U.S. Department of Education — College Scorecard
- O*NET Online (Bureau of Labor Statistics)
- National Center for Education Statistics
More about our data sources and methodologies.
Course Advisor provides higher-education, college and university, degree, program, career, salary, and other helpful information to students, faculty, institutions, and other internet audiences. Presented information and data are subject to change. Inclusion on this website does not imply or represent a direct relationship with the company, school, or brand. Information, though believed correct at time of publication, may not be correct, and no warranty is provided. Contact the schools to verify any information before relying on it. Financial aid may be available for those who qualify. The displayed options may include sponsored or recommended results, not necessarily based on your preferences.
© Course Advisor – All Rights Reserved.