Music at Carthage College
What traits are you looking for in a school for Music, you may want to check out the program at Carthage College. We’ve gathered the following information to help you decide.
Carthage College is located in Kenosha, WI.
In the most recent year for which we have data, 24 music graduations were recorded at Carthage College.
Featured schools near , edit
Studying Online at Carthage College
Online coursework is an option at Carthage College. Of 2,844 students, 0 (0%) were enrolled entirely in distance education and 103 (4%) took at least some classes online.
Music Rankings at Carthage College
These rankings give you a sense of how Carthage College’s Music program against peer institutions.
Bachelor’s-Level Rankings
| Ranking | Scope | Rank |
|---|---|---|
| Best Schools (Quality) | Wisconsin | #7 of 8 |
| Best Value | Wisconsin | #8 of 8 |
| Best Schools (Quality) | Great Lakes (Region) | #34 of 53 |
| Best Value | Great Lakes (Region) | #42 of 53 |
| Best Schools (Quality) | Nationwide | #267 of 423 |
| Best Value | Nationwide | #332 of 421 |
Master’s-Level Rankings
| Ranking | Scope | Rank |
|---|---|---|
| Best Schools (Quality) | Wisconsin | #7 of 8 |
| Best Value | Wisconsin | #8 of 8 |
| Best Schools (Quality) | Great Lakes (Region) | #34 of 53 |
| Best Value | Great Lakes (Region) | #42 of 53 |
| Best Schools (Quality) | Nationwide | #267 of 423 |
| Best Value | Nationwide | #332 of 421 |
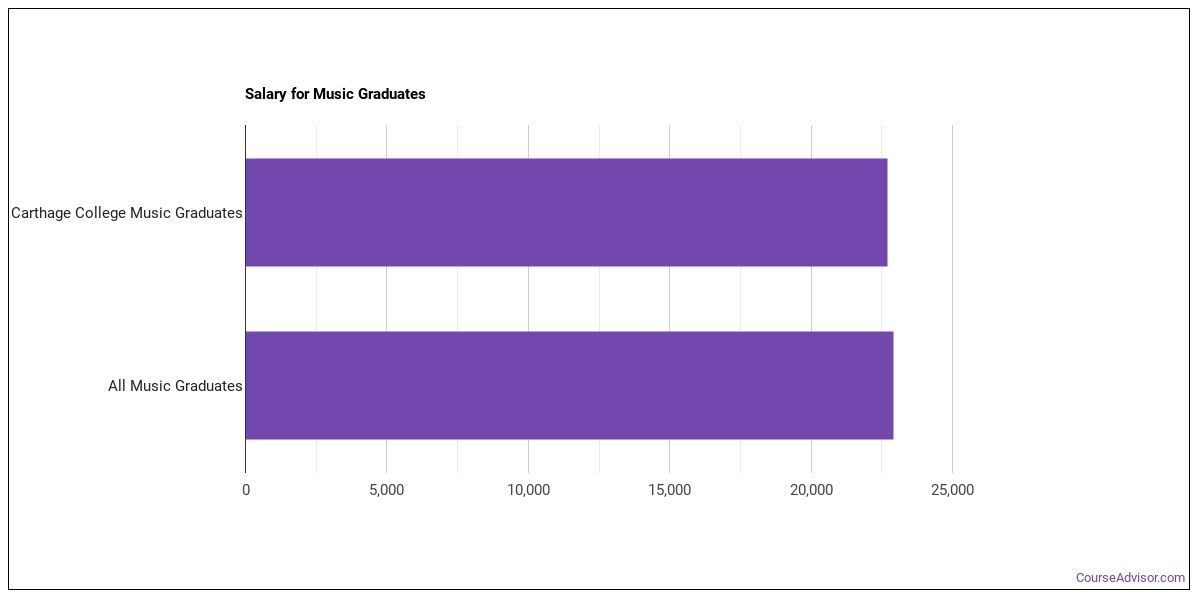
Earnings for Music Graduates from Carthage College
Graduates of Carthage College’s Music program earn at the following median levels (per the U.S. Department of Education’s College Scorecard):
| Years After Graduation | Median Earnings |
|---|---|
| 2 years | $24,421 |
| 3 years | $37,585 |
| 4 years | $33,288 |
| 5 years | $45,258 |
Is this above or below average for the school? Four years out, Music graduates from Carthage College take home a median $33,288, compared with $54,469 for all Carthage College graduates — about 39% lower than the school-wide median.

Median Debt at Graduation
Median student loan debt for Music graduates from Carthage College is $27,000.
Student Demographics & Diversity
Below you’ll find the composition of Music graduates at Carthage College, broken down by degree level.
Program-wide, Music graduates at Carthage College are 67% women (16) and 33% men (8).
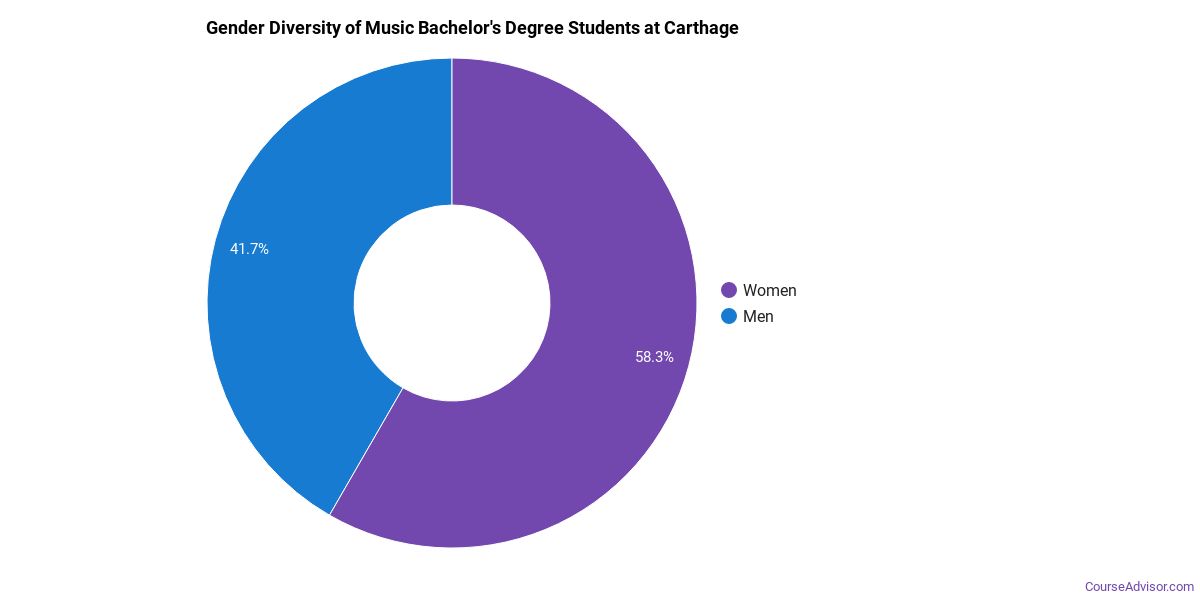
Music Bachelor’s Program at Carthage College
Of the 12 bachelor’s music graduates at Carthage College, 67% were women (8) and 33% were men (4).
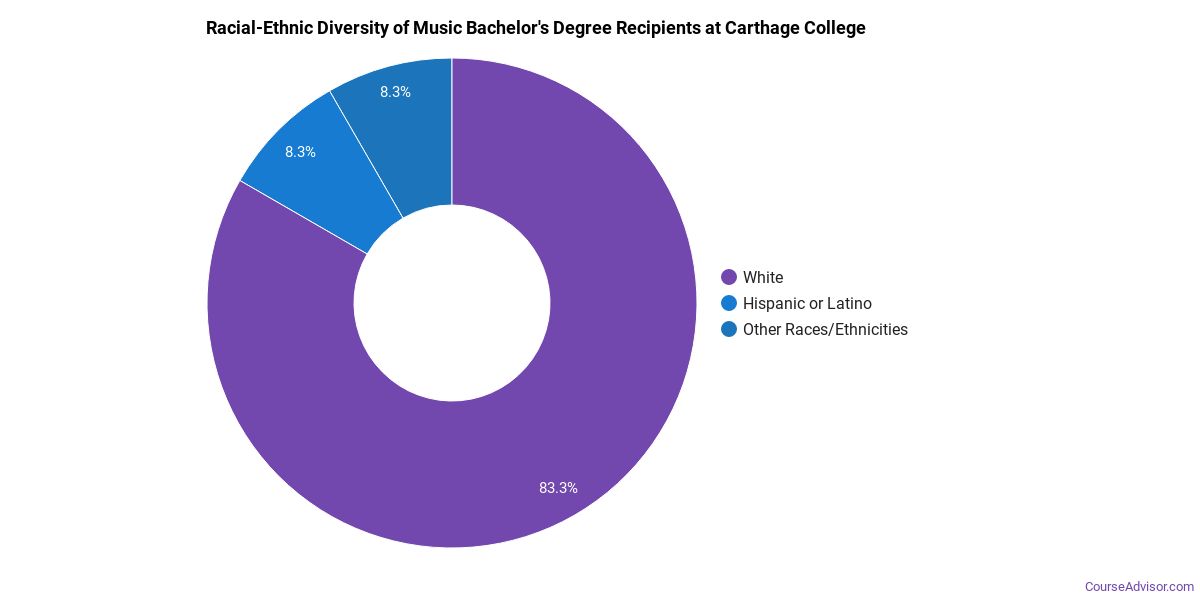
The following table and chart show the race/ethnicity of Music bachelor’s degree recipients at Carthage College.
| Race / Ethnicity | Number of Graduates |
|---|---|
| White | 6 |
| International (Nonresident) | 3 |
| Unknown | 3 |
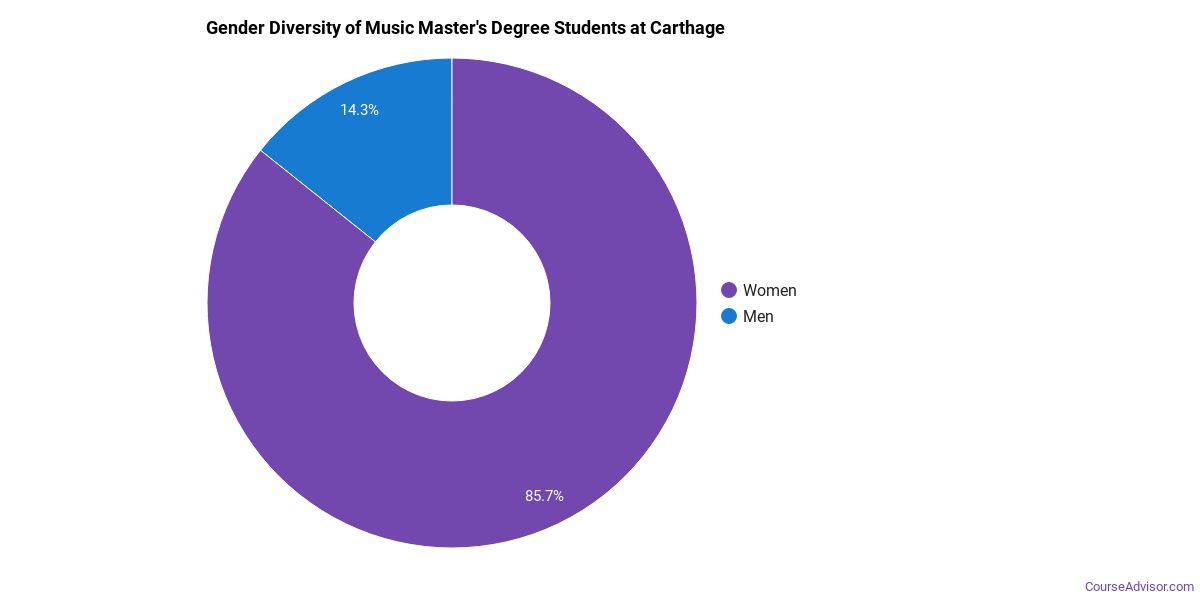
Music Master’s Program at Carthage College
Among the 12 master’s music degrees awarded at Carthage College, 67% were women (8) and 33% were men (4).
The following table and chart show the race/ethnicity of Music master’s degree recipients at Carthage College.
| Race / Ethnicity | Number of Graduates |
|---|---|
| White | 1 |
| Asian | 1 |
| American Indian / Alaska Native | 1 |
| International (Nonresident) | 9 |
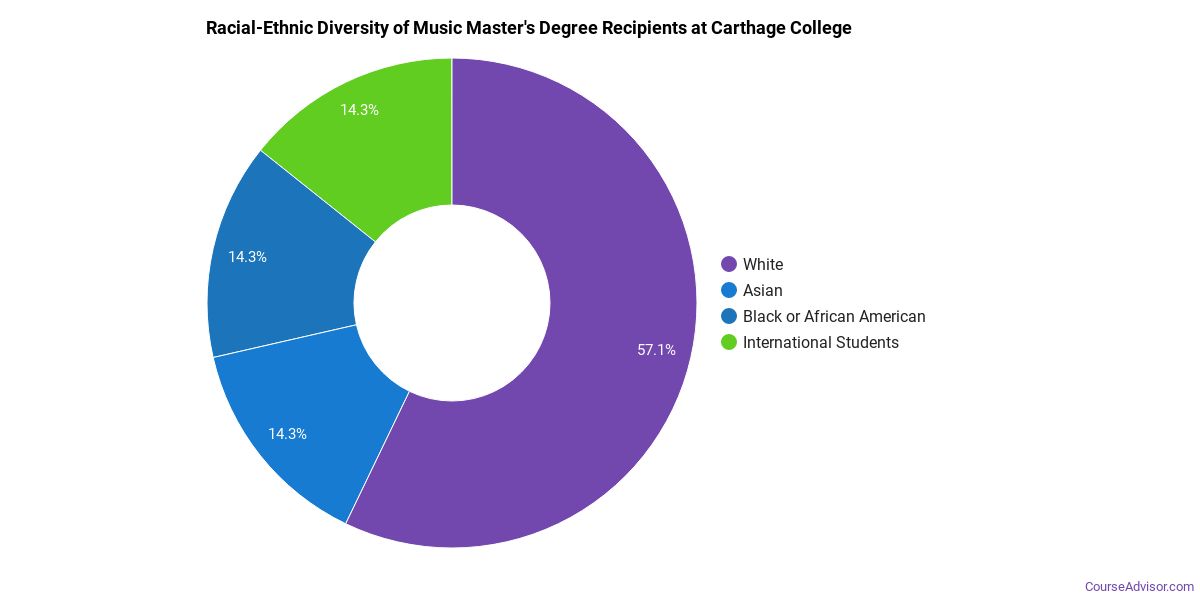
Minority students account for 17% of Music master’s degree recipients at Carthage College, lower than the national average of 23%.*
*The racial-ethnic minorities figure is the total number of graduates minus White, international (nonresident), and unknown-race graduates.
More Specific Music Concentrations at Carthage College
The Music program at Carthage College offers more specialized concentrations:
| Concentration | Graduates |
|---|---|
| General Music | 7 |
| Music Performance | 3 |
| Voice Performance | 2 |
| Music Pedagogy | 12 |
Highest-Paying Careers for Music Graduates
Students who finish Music program at Carthage College go on to a range of careers. The table below ranks the top-paying careers for Music majors, ordered by median annual salary:
| Occupation | Nationwide Median Wage |
|---|---|
| Musicians and Singers | $96,571 |
| Disc Jockeys, Except Radio | $87,328 |
| Secondary School Teachers, Except Special and Career/Technical Education | $77,927 |
| Music Directors and Composers | $66,915 |
| Sound Engineering Technicians | $66,427 |
| Art, Drama, and Music Teachers, Postsecondary | $46,983 |
References
- IPEDS — Integrated Postsecondary Education Data System
- U.S. Department of Education — College Scorecard
- O*NET Online (Bureau of Labor Statistics)
- National Center for Education Statistics
More about our data sources and methodologies.
Course Advisor provides higher-education, college and university, degree, program, career, salary, and other helpful information to students, faculty, institutions, and other internet audiences. Presented information and data are subject to change. Inclusion on this website does not imply or represent a direct relationship with the company, school, or brand. Information, though believed correct at time of publication, may not be correct, and no warranty is provided. Contact the schools to verify any information before relying on it. Financial aid may be available for those who qualify. The displayed options may include sponsored or recommended results, not necessarily based on your preferences.
© Course Advisor – All Rights Reserved.