Music at Brown University
What traits are you looking for in a school for Music, consider the program at Brown University. The following information will help you decide if it is a good fit for you.
Brown University sits in Providence, RI.
In the most recent year for which we have data, 33 music graduations were recorded at Brown University.
Featured schools near , edit
Online & Distance Learning at Brown University
Many students take online classes at Brown University. Among 11,956 students, 758 (6%) were enrolled entirely in distance education and 238 (2%) took at least some classes online.
Music Rankings at Brown University
These rankings give you a sense of how Brown University’s Music program to other colleges that offer this major.
Bachelor’s-Level Rankings
| Ranking | Scope | Rank |
|---|---|---|
| Best Schools (Quality) | Rhode Island | #1 of 2 |
| Best Schools (Quality) | New England (Region) | #2 of 25 |
| Best Value | Rhode Island | #2 of 2 |
| Best Value | New England (Region) | #15 of 25 |
| Best Schools (Quality) | Nationwide | #21 of 423 |
| Best Value | Nationwide | #339 of 421 |
Master’s-Level Rankings
| Ranking | Scope | Rank |
|---|---|---|
| Best Schools (Quality) | Rhode Island | #1 of 2 |
| Best Schools (Quality) | New England (Region) | #2 of 25 |
| Best Value | Rhode Island | #2 of 2 |
| Best Value | New England (Region) | #15 of 25 |
| Best Schools (Quality) | Nationwide | #21 of 423 |
| Best Value | Nationwide | #339 of 421 |
Doctoral-Level Rankings
| Ranking | Scope | Rank |
|---|---|---|
| Best Schools (Quality) | Rhode Island | #1 of 2 |
| Best Schools (Quality) | New England (Region) | #2 of 25 |
| Best Value | Rhode Island | #2 of 2 |
| Best Value | New England (Region) | #15 of 25 |
| Best Schools (Quality) | Nationwide | #21 of 423 |
| Best Value | Nationwide | #339 of 421 |
Student Demographics & Diversity
The following sections describe the composition of Music graduates at Brown University, by degree type.
Program-wide, Music graduates at Brown University are 42% women (14) and 58% men (19).
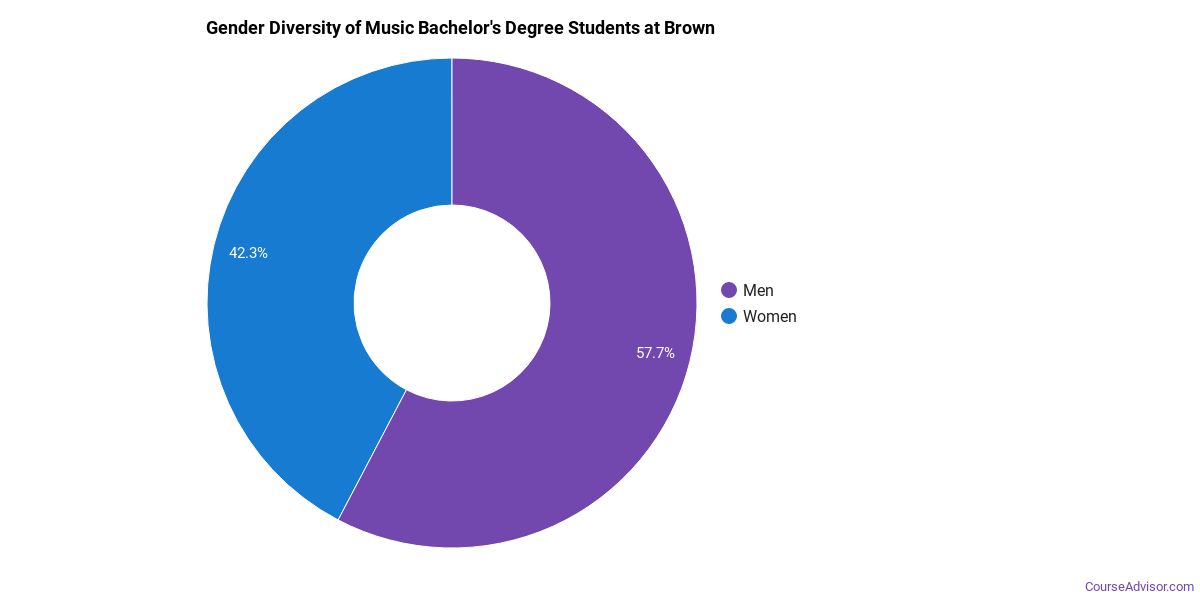
Music Bachelor’s Program at Brown University
Of the 30 bachelor’s music graduates at Brown University, 43% were women (13) and 57% were men (17).
The following table and chart show the race/ethnicity of Music bachelor’s degree recipients at Brown University.
| Race / Ethnicity | Number of Graduates |
|---|---|
| White | 17 |
| Hispanic / Latino | 1 |
| Black / African American | 2 |
| Asian | 6 |
| Two or More Races | 2 |
| International (Nonresident) | 2 |
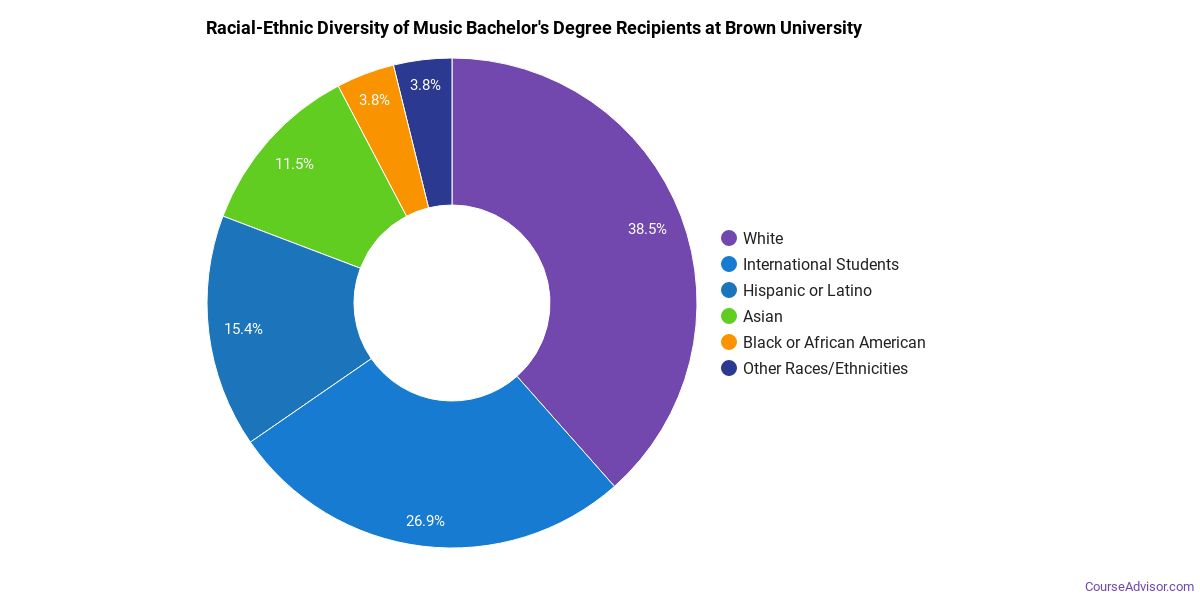
Minority students account for 37% of Music bachelor’s degree recipients at Brown University, above the national average of 34%.*
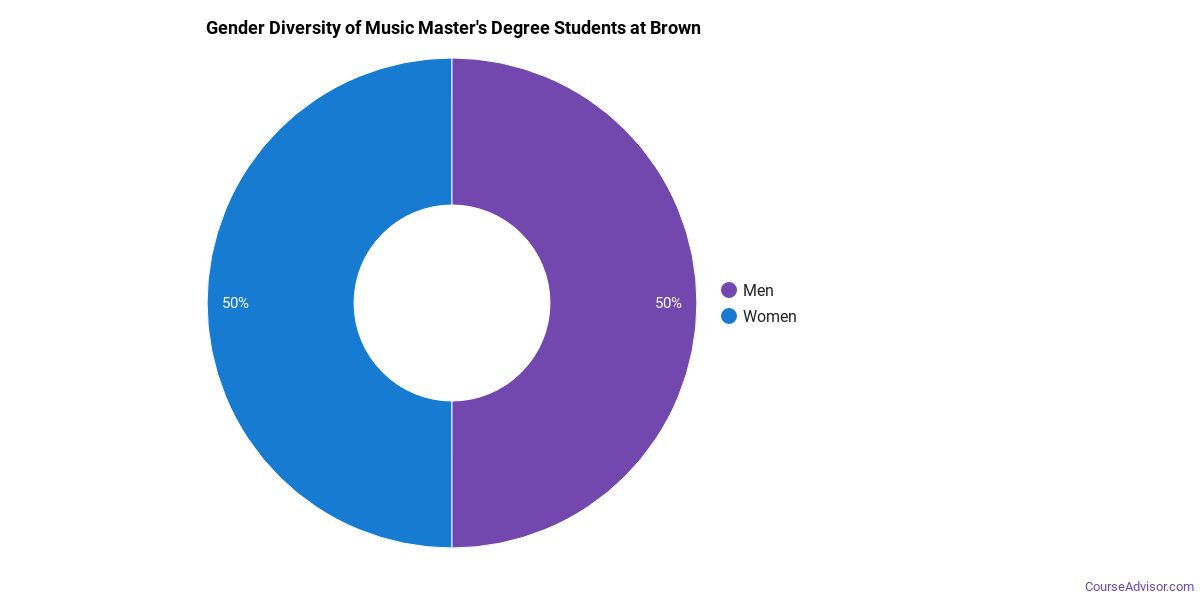
Music Master’s Program at Brown University
Among the 2 master’s music degrees awarded at Brown University, 0% were women (0) and 100% were men (2).
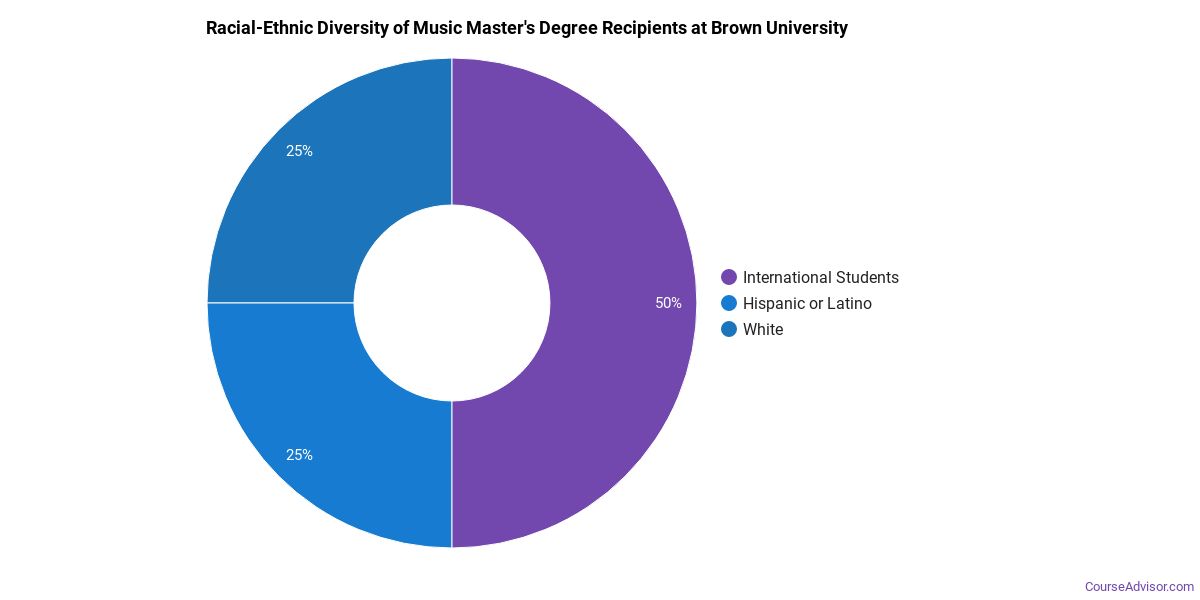
The following table and chart show the race/ethnicity of Music master’s degree recipients at Brown University.
| Race / Ethnicity | Number of Graduates |
|---|---|
| White | 2 |
Music Doctoral Program at Brown University
Of the 1 doctoral music graduates at Brown University, 100% were women (1) and 0% were men (0).

The following table and chart show the race/ethnicity of Music doctoral degree recipients at Brown University.
| Race / Ethnicity | Number of Graduates |
|---|---|
| White | 1 |

*The racial-ethnic minorities figure is the total number of graduates minus White, international (nonresident), and unknown-race graduates.
More Specific Music Concentrations at Brown University
This Music program at Brown University breaks down into more specific concentrations:
| Concentration | Graduates |
|---|---|
| General Music | 30 |
| Musicology & Ethnomusicology | 3 |
Best-Paid Careers for Music Graduates
Students who finish Music program at Brown University pursue many career paths. The table below ranks the highest-paying careers for Music graduates, ordered by median annual salary:
| Occupation | Nationwide Median Wage |
|---|---|
| Musicians and Singers | $96,571 |
| Disc Jockeys, Except Radio | $87,328 |
| Secondary School Teachers, Except Special and Career/Technical Education | $77,927 |
| Music Directors and Composers | $66,915 |
| Sound Engineering Technicians | $66,427 |
| Art, Drama, and Music Teachers, Postsecondary | $46,983 |
References
- IPEDS — Integrated Postsecondary Education Data System
- U.S. Department of Education — College Scorecard
- O*NET Online (Bureau of Labor Statistics)
- National Center for Education Statistics
More about our data sources and methodologies.
Course Advisor provides higher-education, college and university, degree, program, career, salary, and other helpful information to students, faculty, institutions, and other internet audiences. Presented information and data are subject to change. Inclusion on this website does not imply or represent a direct relationship with the company, school, or brand. Information, though believed correct at time of publication, may not be correct, and no warranty is provided. Contact the schools to verify any information before relying on it. Financial aid may be available for those who qualify. The displayed options may include sponsored or recommended results, not necessarily based on your preferences.
© Course Advisor – All Rights Reserved.