Bowling Green State University - Main Campus Overview
Bowling Green State University - Main Campus is a public institution situated in Bowling Green, Ohio. The surrounding location of Bowling Green is ideal for students who enjoy the charms of a college town.
What Is Bowling Green State University - Main Campus Known For?
- The doctor's degree is the highest award offered at BGSU.
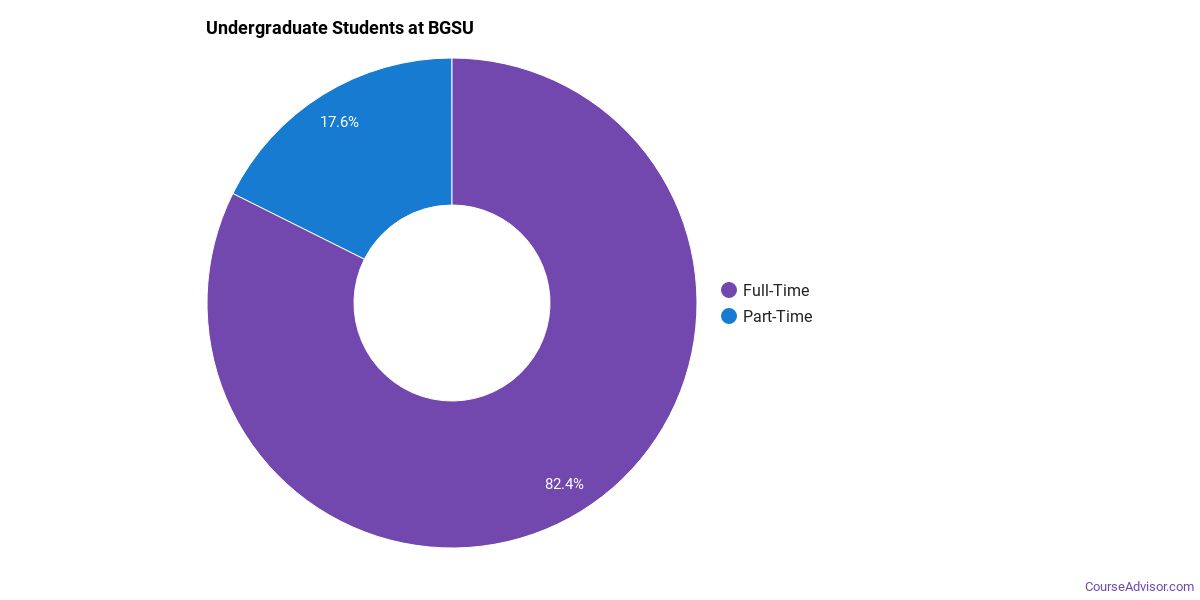
- In a recent academic period70% of the faculty were full-time.
- A student who earns a bachelor's degree from BGSU makes roughly $47,896 a year. This is 17% more than their peers from other colleges and universities.
Where Is Bowling Green State University - Main Campus?
Contact details for BGSU are given below.
| Contact Details | |
|---|---|
| Address: | 220 Mcfall Ctr, Bowling Green, OH 43403 |
| Phone: | 418-372-5526 |
| Website: | www.bgsu.edu |
How Do I Get Into BGSU?
You can apply to BGSU online at: www.bgsu.edu/
Admission Requirements for BGSU
| Submission | Required? |
|---|---|
| High School GPA | 1 |
| High School Rank | 5 |
| High School Transcript | 1 |
| College Prep Program | 1 |
| Recommendations | 5 |
| SAT or ACT Scores | 5 |
| TOEFL | 1 |
How Hard Is It To Get Into BGSU?
Approximately 38% of accepted students are men and 62% are women. The acceptance rate for men is 77%, and the acceptance rate for women is 80%.
Average Test Scores
About 19% of students accepted to BGSU submitted their SAT scores. When looking at the 25th through the 75th percentile, SAT Evidence-Based Reading and Writing scores ranged between 490 and 600. Math scores were between 500 and 600.
Can I Afford Bowling Green State University - Main Campus?
The net price is calculated by adding tuition, room, board and other costs and subtracting financial aid.
Student Loan Debt
It's not uncommon for college students to take out loans to pay for school. In fact, almost 66% of students nationwide depend at least partially on loans. At BGSU, approximately 62% of students took out student loans averaging $7,683 a year. That adds up to $30,732 over four years for those students.
Explore Best Ranked Schools for You
Bowling Green State University - Main Campus Undergraduate Student Diversity
There are also 3,154 graduate students at the school.
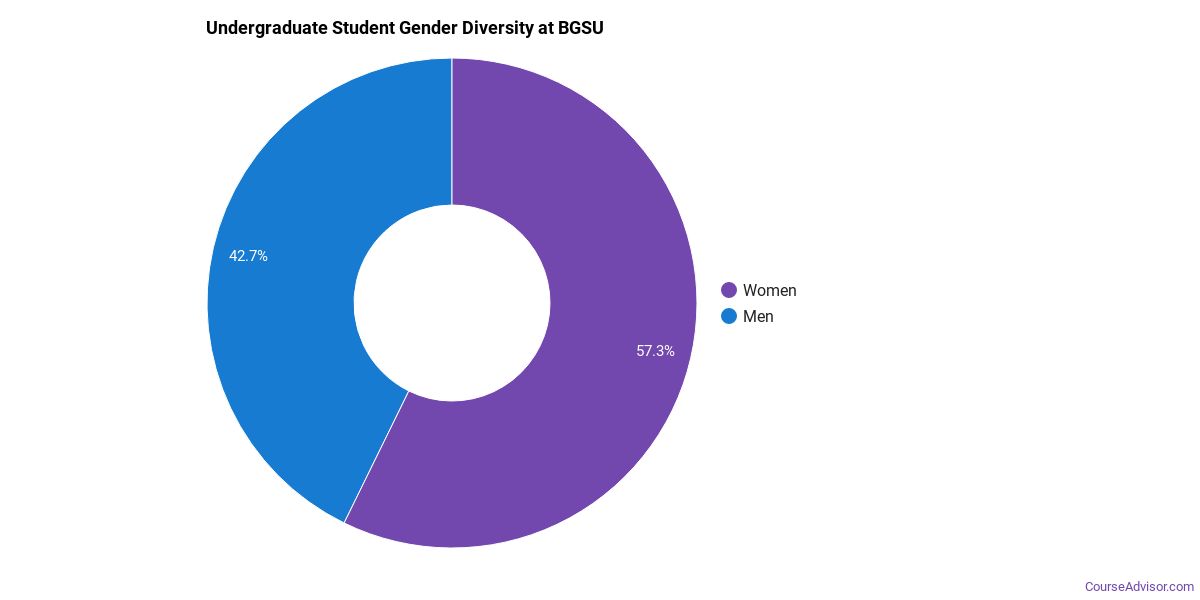
Gender Diversity
Of the 12,483 full-time undergraduates at BGSU, 43% are male and 57% are female.
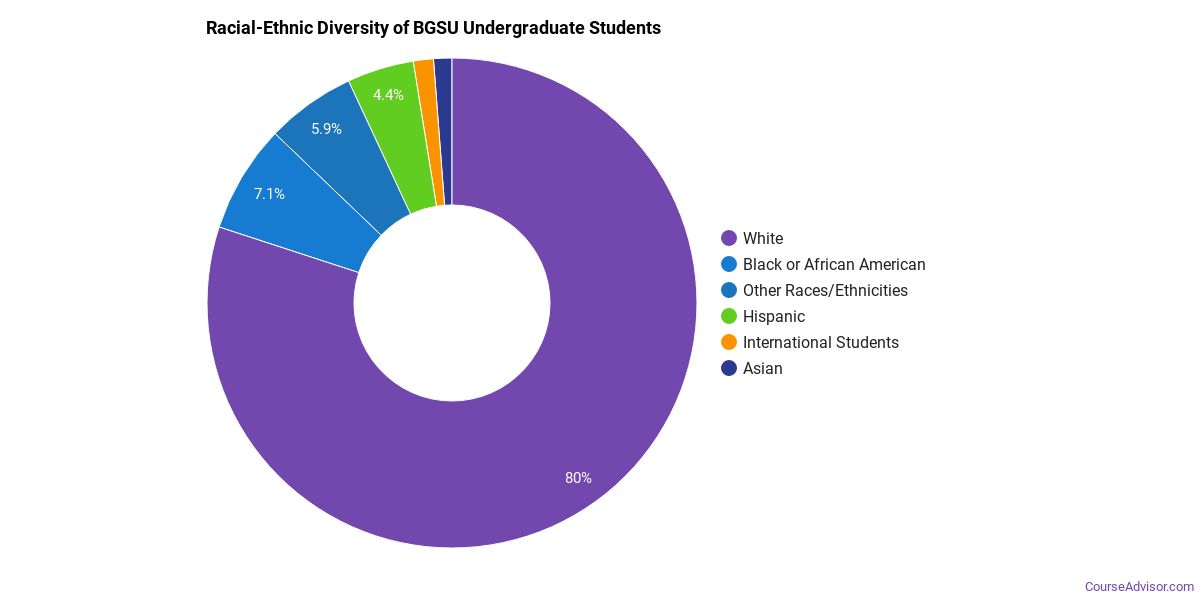
Racial-Ethnic Diversity
The racial-ethnic breakdown of Bowling Green State University - Main Campus students is as follows.
| Race/Ethnicity | Number of Grads |
|---|---|
| Asian | 154 |
| Black or African American | 955 |
| Hispanic or Latino | 516 |
| White | 9,962 |
| International Students | 155 |
| Other Races/Ethnicities | 741 |
Geographic Diversity
Ohio students aren't the only ones who study at Bowling Green State University - Main Campus. At this time, 34 states are represented by the student population at the school.
Over 84 countries are represented at BGSU. The most popular countries sending students to the school are China, India, and Saudi Arabia.
Bowling Green State University - Main Campus Undergraduate Concentrations
The table below shows the number of awards for each concentration.
References
*The racial-ethnic minorities count is calculated by taking the total number of students and subtracting white students, international students, and students whose race/ethnicity was unknown. This number is then divided by the total number of students at the school to obtain the racial-ethnic minorities percentage.
- College Factual
- National Center for Education Statistics
- Image Credit: By Jeffness under License
More about our data sources and methodologies.
Course Advisor provides higher-education, college and university, degree, program, career, salary, and other helpful information to students, faculty, institutions, and other internet audiences. Presented information and data are subject to change. Inclusion on this website does not imply or represent a direct relationship with the company, school, or brand. Information, though believed correct at time of publication, may not be correct, and no warranty is provided. Contact the schools to verify any information before relying on it. Financial aid may be available for those who qualify. The displayed options may include sponsored or recommended results, not necessarily based on your preferences.
© Course Advisor – All Rights Reserved.