Economics at Bowling Green State University-Main Campus
What traits are you looking for in a school for Economics, take a look at what Bowling Green State University-Main Campus. The following information will help you decide if it is a good fit for you.
Bowling Green State University-Main Campus is located in Bowling Green, OH.
During the most recent reporting year, 30 economics degrees were awarded at Bowling Green State University-Main Campus.
Featured schools near , edit
Online & Distance Learning at Bowling Green State University-Main Campus
Many students take online classes at Bowling Green State University-Main Campus. Among 17,594 students, 2,479 (14%) studied exclusively online and 4,920 (28%) took at least some classes online.
Economics Rankings at Bowling Green State University-Main Campus
These rankings give you a sense of how Bowling Green State University-Main Campus’s Economics program against other schools offering the same major.
Bachelor’s-Level Rankings
| Ranking | Scope | Rank |
|---|---|---|
| Best Value | Ohio | #6 of 15 |
| Best Schools (Quality) | Ohio | #12 of 15 |
| Best Value | Great Lakes (Region) | #35 of 57 |
| Best Schools (Quality) | Great Lakes (Region) | #39 of 57 |
| Best Value | Nationwide | #294 of 463 |
| Best Schools (Quality) | Nationwide | #340 of 466 |
Master’s-Level Rankings
| Ranking | Scope | Rank |
|---|---|---|
| Best Value | Ohio | #6 of 15 |
| Best Schools (Quality) | Ohio | #12 of 15 |
| Best Value | Great Lakes (Region) | #35 of 57 |
| Best Schools (Quality) | Great Lakes (Region) | #39 of 57 |
| Best Value | Nationwide | #294 of 463 |
| Best Schools (Quality) | Nationwide | #340 of 466 |
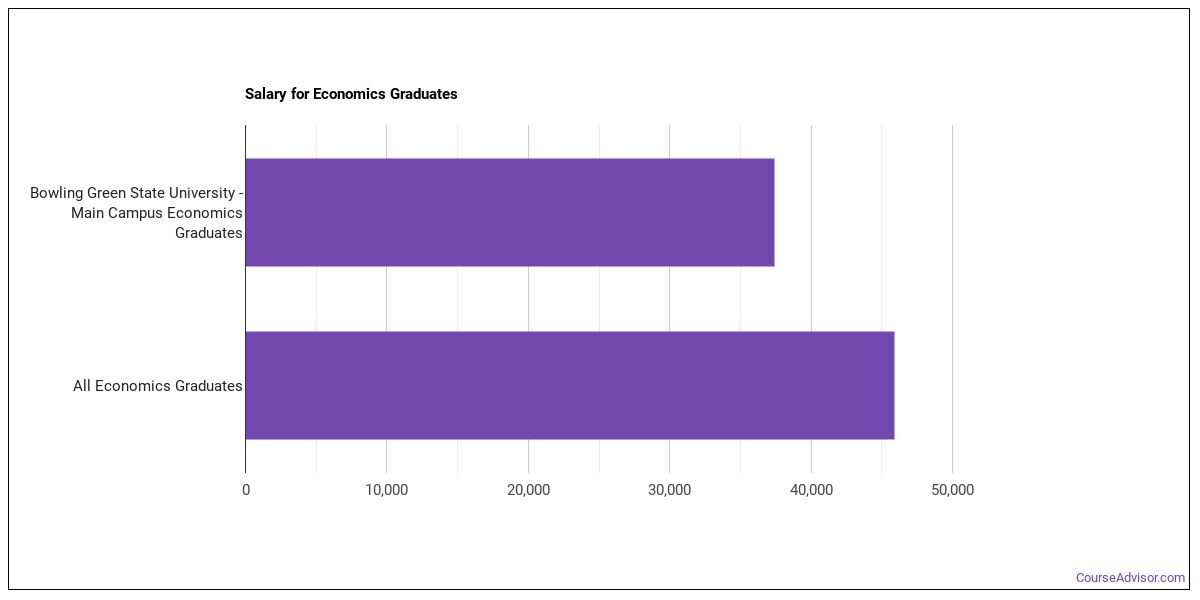
Earnings for Economics Graduates from Bowling Green State University-Main Campus
Graduates of Bowling Green State University-Main Campus’s Economics program earn at the following median levels (per the U.S. Department of Education’s College Scorecard):
| Years After Graduation | Median Earnings |
|---|---|
| 1 year | $37,428 |
| 2 years | $50,439 |
| 3 years | $52,092 |
| 4 years | $62,885 |
| 5 years | $67,556 |
Is this above or below average for the school? Four years out, Economics graduates from Bowling Green State University-Main Campus report median earnings of $62,885, compared with $53,424 for all Bowling Green State University-Main Campus graduates — about 18% higher than the school-wide median.

Median Debt at Graduation
The median debt for Economics graduates from Bowling Green State University-Main Campus comes in at $23,625.
Student Demographics & Diversity
The following sections describe the student demographics for Economics graduates at Bowling Green State University-Main Campus, by degree type.
Looking at the program as a whole, Economics graduates at Bowling Green State University-Main Campus are 30% women (9) and 70% men (21).
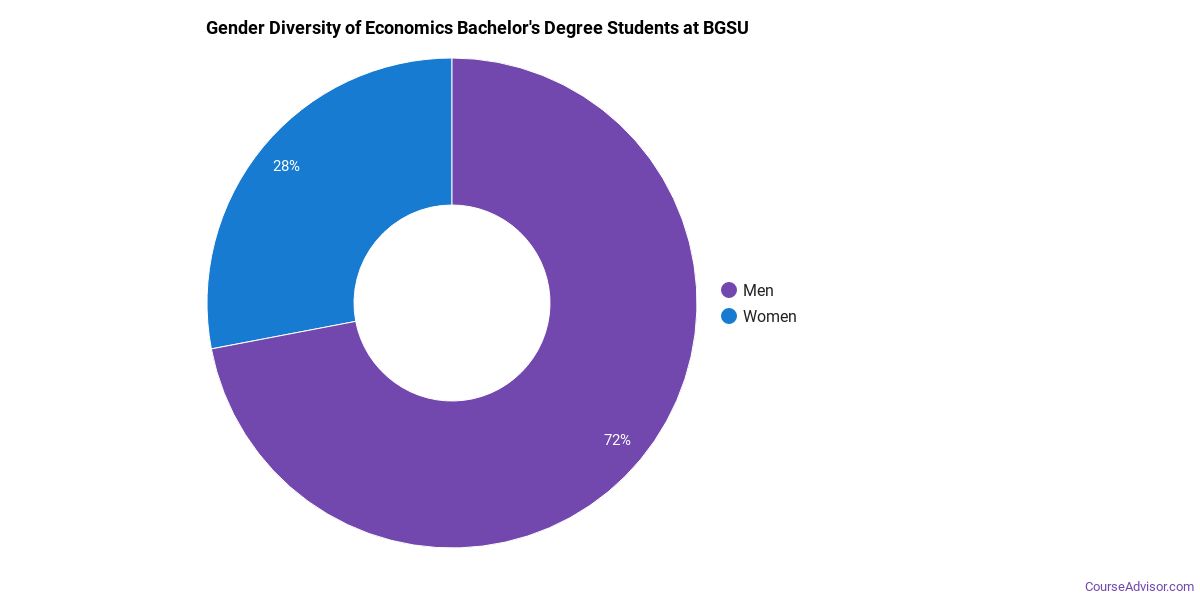
Economics Bachelor’s Program at Bowling Green State University-Main Campus
Of the 18 bachelor’s economics graduates at Bowling Green State University-Main Campus, 22% were women (4) and 78% were men (14).
The following table and chart show the race/ethnicity of Economics bachelor’s degree recipients at Bowling Green State University-Main Campus.
| Race / Ethnicity | Number of Graduates |
|---|---|
| White | 12 |
| Asian | 1 |
| Two or More Races | 2 |
| International (Nonresident) | 1 |
| Unknown | 2 |
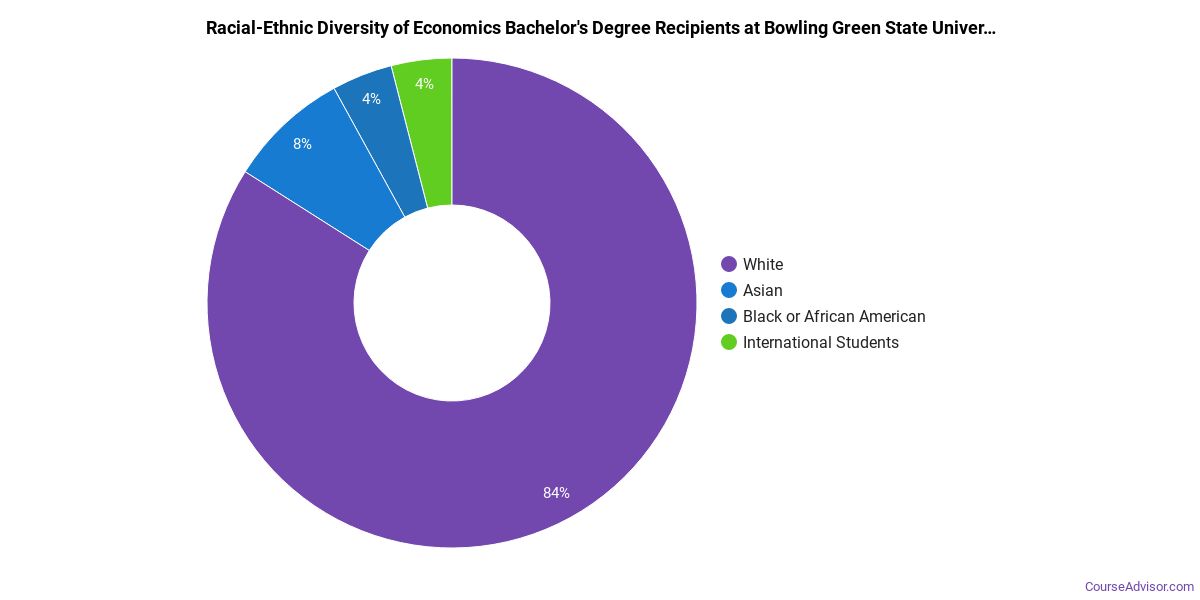
Minority students account for 17% of Economics bachelor’s degree recipients at Bowling Green State University-Main Campus, below the national average of 34%.*
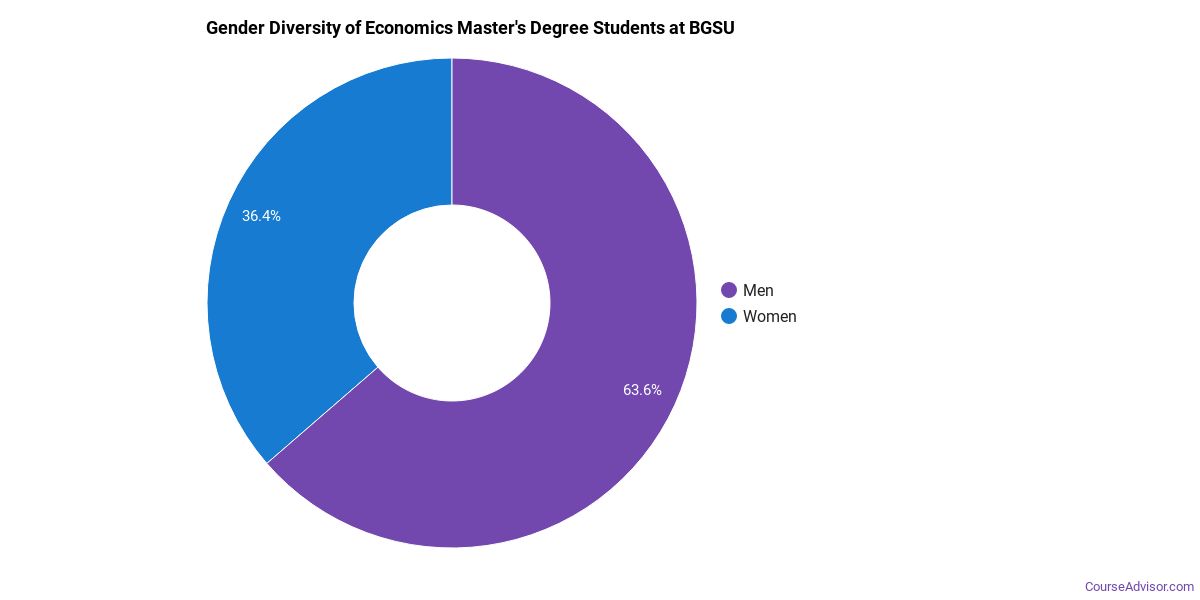
Economics Master’s Program at Bowling Green State University-Main Campus
Among the 12 master’s economics graduates at Bowling Green State University-Main Campus, 42% were women (5) and 58% were men (7).
The following table and chart show the race/ethnicity of Economics master’s degree recipients at Bowling Green State University-Main Campus.
| Race / Ethnicity | Number of Graduates |
|---|---|
| White | 1 |
| Black / African American | 2 |
| International (Nonresident) | 9 |
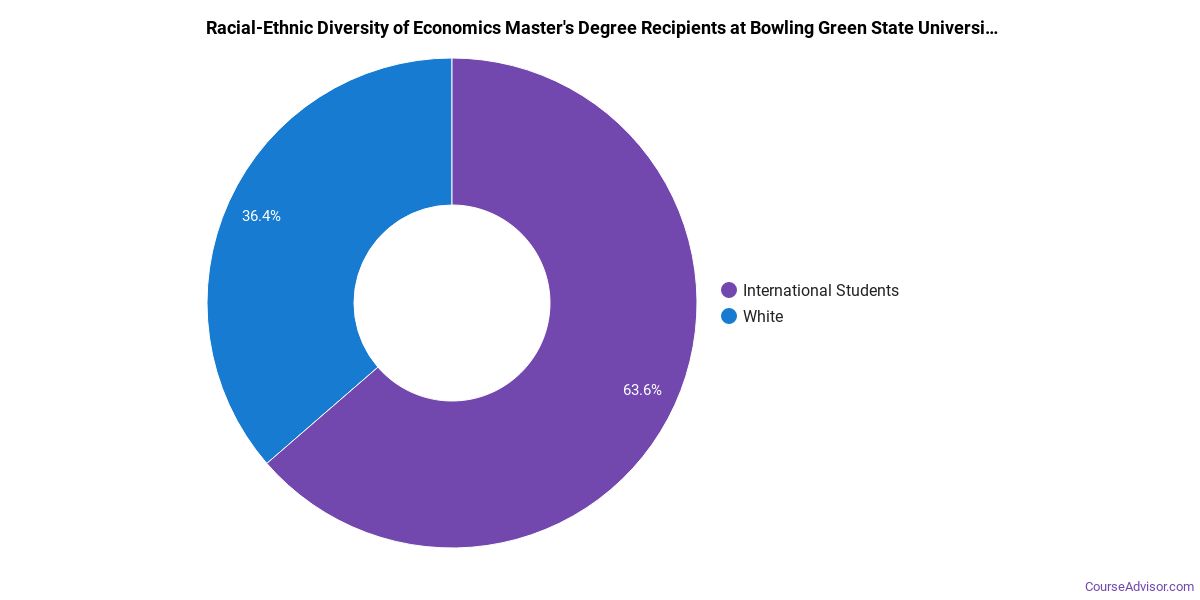
Racial-ethnic minorities make up 17% of Economics master’s degree recipients at Bowling Green State University-Main Campus, higher than the national average of 14%.*
*The racial-ethnic minorities figure is the total number of graduates minus White, international (nonresident), and unknown-race graduates.
More Specific Economics Concentrations at Bowling Green State University-Main Campus
The Economics program at Bowling Green State University-Main Campus offers more specialized concentrations:
| Concentration | Graduates |
|---|---|
| General Economics | 14 |
| Applied Economics | 4 |
| Quantitative Economics | 12 |
Top-Paying Careers for Economics Graduates
Those who complete Economics program at Bowling Green State University-Main Campus work across a variety of fields. Below are the best-paid careers for Economics graduates, ordered by median annual salary:
| Occupation | Nationwide Median Wage |
|---|---|
| Wind Energy Development Managers | $169,952 |
| Loss Prevention Managers | $165,723 |
| Business Intelligence Analysts | $143,840 |
| Statisticians | $130,349 |
| Market Research Analysts and Marketing Specialists | $124,518 |
| Wind Energy Operations Managers | $122,567 |
| Biostatisticians | $121,594 |
| Compliance Managers | $117,178 |
| Survey Researchers | $108,538 |
| Data Scientists | $106,295 |
References
- IPEDS — Integrated Postsecondary Education Data System
- U.S. Department of Education — College Scorecard
- O*NET Online (Bureau of Labor Statistics)
- National Center for Education Statistics
More about our data sources and methodologies.
Course Advisor provides higher-education, college and university, degree, program, career, salary, and other helpful information to students, faculty, institutions, and other internet audiences. Presented information and data are subject to change. Inclusion on this website does not imply or represent a direct relationship with the company, school, or brand. Information, though believed correct at time of publication, may not be correct, and no warranty is provided. Contact the schools to verify any information before relying on it. Financial aid may be available for those who qualify. The displayed options may include sponsored or recommended results, not necessarily based on your preferences.
© Course Advisor – All Rights Reserved.