Sales Representatives in Illinois
Considering a career as a Sales Representative in Illinois?
You’re in luck! Jobs for Sales Representatives in Illinois are projected to grow and these jobs tend to pay higher than average.
-
Projected employment for Sales Representatives in Illinois is growing faster than average.
-
Sales Representatives in Illinois earn higher salaries than the typical U.S. wage earner.
Featured schools near , edit
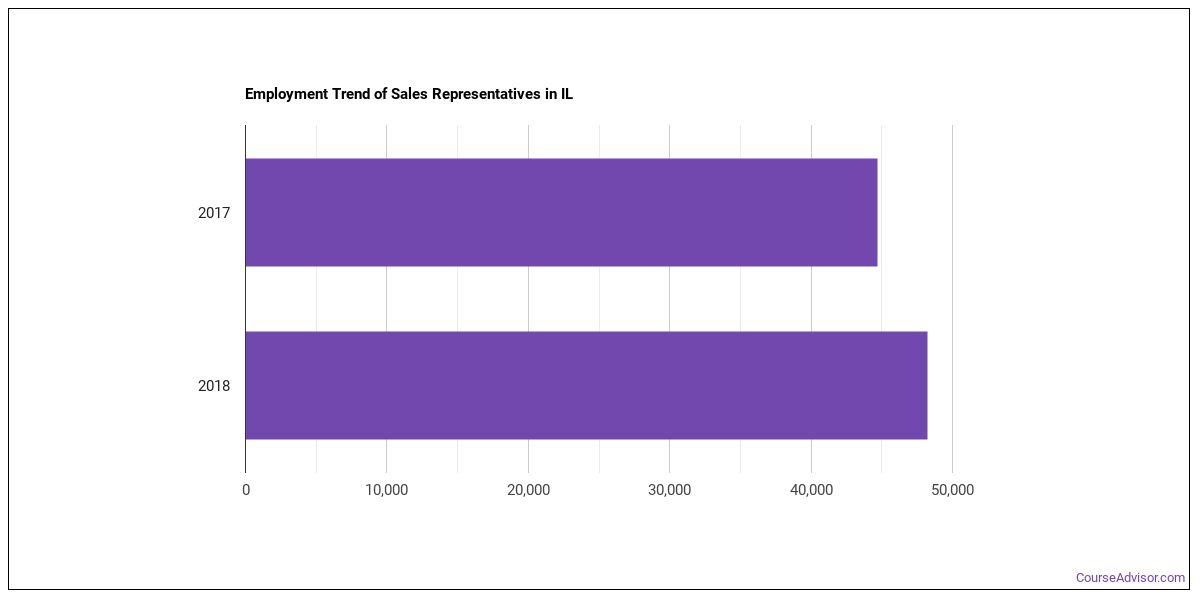
How Many Sales Representatives Work in Illinois?
There were approximately 48,250 workers employed as Sales Representatives in this state in 2018.
There were 44,730 Sales Representatives employed in this state in 2017.
That’s growth of 3,520 jobs between 2017 and 2018.
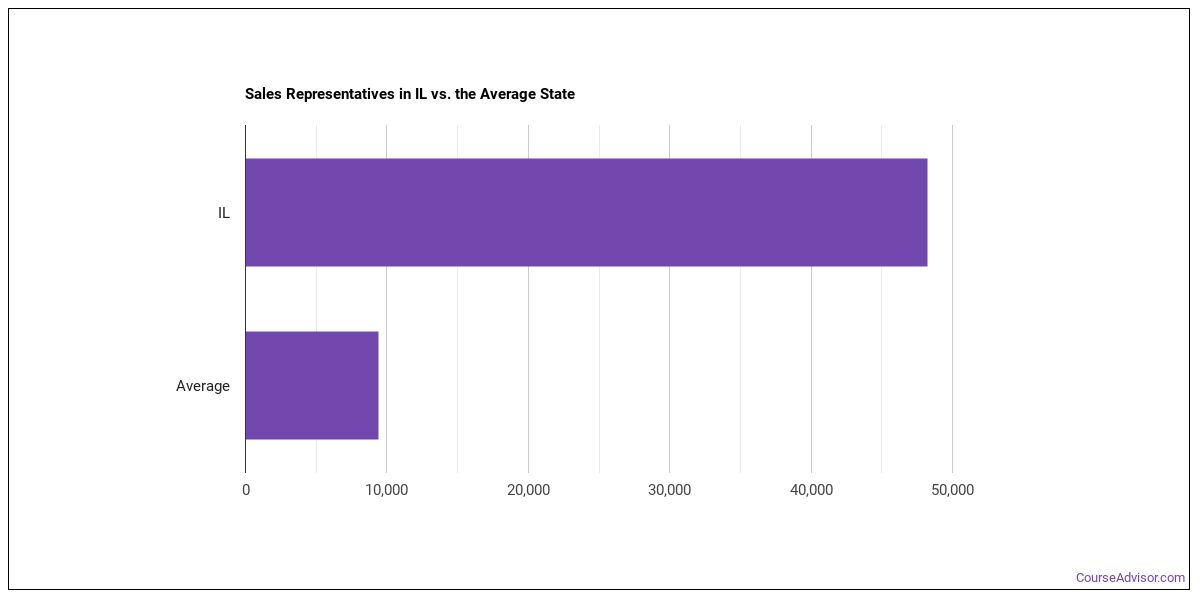
The typical state has 9,410 Sales Representatives working in it, which means Illinois has more Sales Representatives than average.
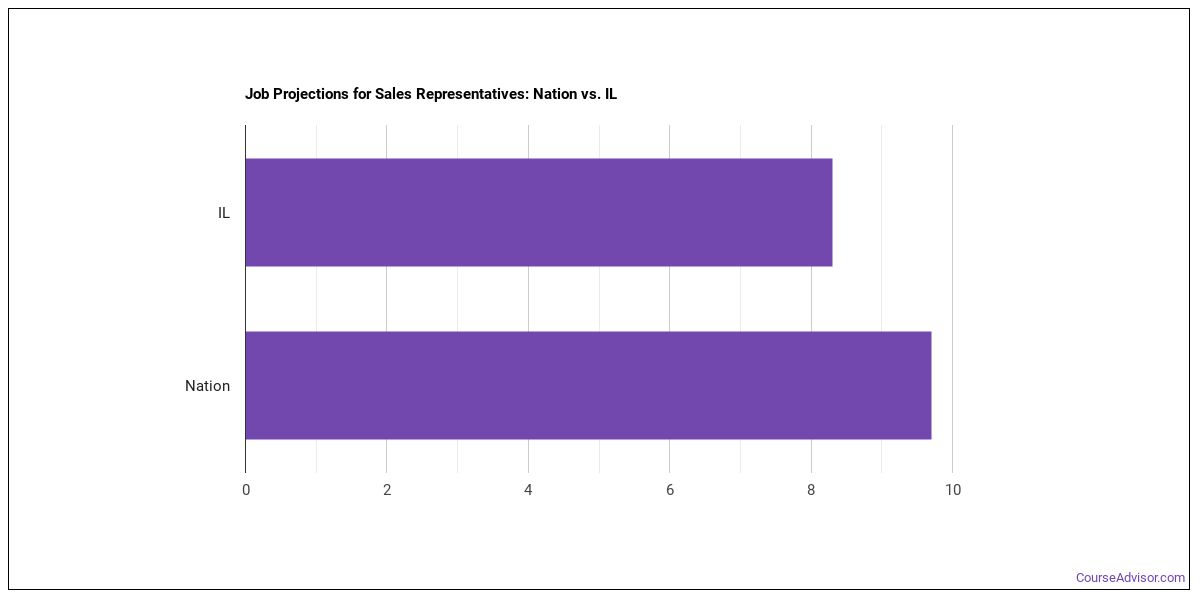
Job Projections for Illinois
Jobs for Sales Representatives in this state are growing at a rate of 8.3% which is slower than the nationwide estimated projection of 9.7%.
Illinois Annual Job Openings
The BLS estimates 5,280 annual job openings, and a total of 43,620 jobs for Illinois Sales Representatives in 2026.
Nationwide, the prediction is 131,000 annual jobs and 1,077,900 total jobs in 2026.
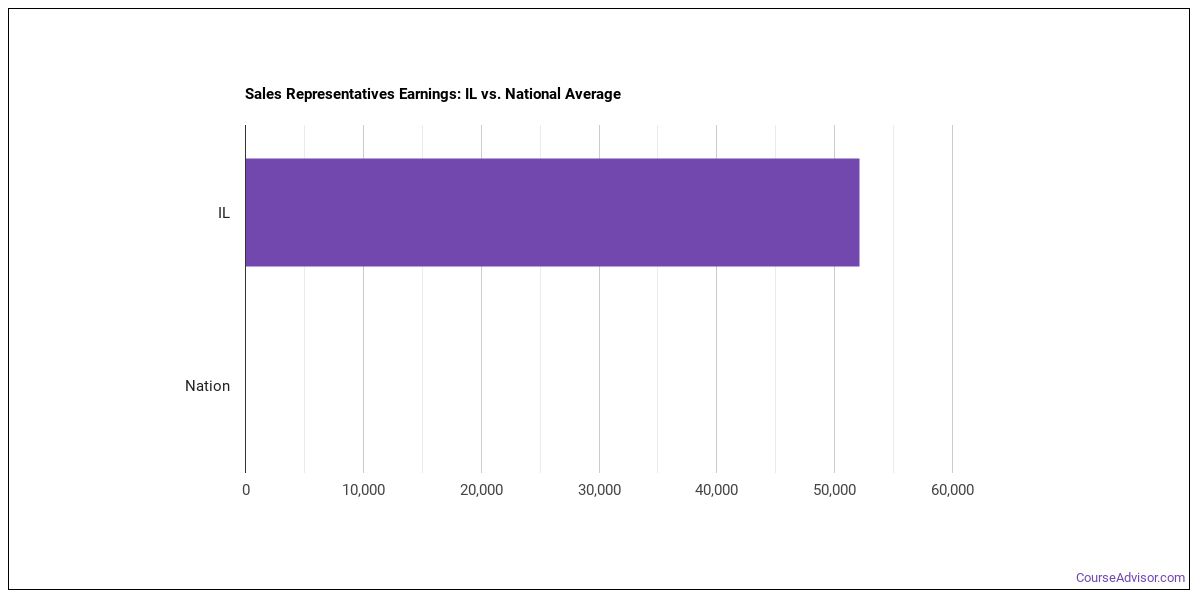
What do Sales Representatives Make in Illinois?
In 2018 wages for Sales Representatives ranged from $23,870 to $111,720 with $52,090 being the median annual salary.
Broken down to an hourly rate, workers in this field made anywhere from $11.48 to $53.71. The median hourly rate was $25.04.
Workers in this field were paid a median of $23.96 an hour in 2017.
The hourly rate grew by $1.08.
The median salary in Illinois is higher than the nationwide median salary.
Top Illinois Metros for Sales Representatives
The table below shows some of the metros in this state with the most Sales Representatives.
| Metro | Number Employed | Annual Median Salary |
|---|---|---|
| Chicago-Naperville-Elgin, IL-IN-WI | 41,410 | $53,770 |
| St. Louis, MO-IL | 10,990 | $45,040 |
| Rockford, IL | 1,180 | $56,440 |
| Davenport-Moline-Rock Island, IA-IL | 1,120 | $46,510 |
| Peoria, IL | 830 | $45,170 |
| Springfield, IL | 620 | $50,840 |
| Bloomington, IL | 450 | $45,100 |
| Champaign-Urbana, IL | 440 | $42,060 |
| Cape Girardeau, MO-IL | 410 | $44,430 |
| Carbondale-Marion, IL | 160 | $33,500 |
| Kankakee, IL | 150 | $43,750 |
| Decatur, IL | 140 | $54,050 |
| Danville, IL | 40 | $54,190 |
Top States for Sales Representatives Employment
View the list below to see where most Sales Representatives work.
| State | Number Employed | Annual Median Salary |
|---|---|---|
| California | 135,330 | $57,710 |
| Texas | 115,340 | $52,900 |
| Florida | 83,150 | $46,800 |
| New York | 70,340 | $64,050 |
| Illinois | 48,250 | $52,090 |
| Georgia | 36,860 | $52,350 |
| Ohio | 35,370 | $50,750 |
| New Jersey | 35,360 | $68,860 |
| Pennsylvania | 35,260 | $58,910 |
| North Carolina | 33,230 | $50,430 |
| Virginia | 31,890 | $62,930 |
| Colorado | 29,750 | $59,030 |
| Maryland | 25,550 | $62,660 |
| Michigan | 25,480 | $53,940 |
| Minnesota | 21,450 | $56,450 |
| Massachusetts | 20,660 | $64,980 |
| Arizona | 20,220 | $47,270 |
| Missouri | 18,770 | $46,480 |
| Tennessee | 17,940 | $47,220 |
| Washington | 17,630 | $58,990 |
Below are the states where Sales Representatives get paid the most:
| State | Annual Median Salary |
|---|---|
| New Jersey | $68,860 |
| District of Columbia | $65,260 |
| Massachusetts | $64,980 |
| New York | $64,050 |
| Virginia | $62,930 |
| Maryland | $62,660 |
| New Hampshire | $60,860 |
| Colorado | $59,030 |
| Washington | $58,990 |
| Pennsylvania | $58,910 |
References
- Bureau of Labor Statistics (BLS)
- College Factual
- National Center for Education Statistics
- O*NET Online
- Image Credit: By Nick Nijhuis under License
More about our data sources and methodologies.
Featured Schools
 Request Info
|
Southern New Hampshire University You have goals. Southern New Hampshire University can help you get there. Whether you need a bachelor's degree to get into a career or want a master's degree to move up in your current career, SNHU has an online program for you. Find your degree from over 200 online programs. Learn More > |
Course Advisor provides higher-education, college and university, degree, program, career, salary, and other helpful information to students, faculty, institutions, and other internet audiences. Presented information and data are subject to change. Inclusion on this website does not imply or represent a direct relationship with the company, school, or brand. Information, though believed correct at time of publication, may not be correct, and no warranty is provided. Contact the schools to verify any information before relying on it. Financial aid may be available for those who qualify. The displayed options may include sponsored or recommended results, not necessarily based on your preferences.
© Course Advisor – All Rights Reserved.