Psychiatric Technicians in California
Want to work as a Psychiatric Technicians in California? Here’s what the data says. Care for individuals with mental or emotional conditions or disabilities, following the instructions of physicians or other health practitioners. Monitor patients’ physical and emotional well-being and report to medical staff. May participate in rehabilitation and treatment programs, help with personal hygiene, and administer oral or injectable medications.
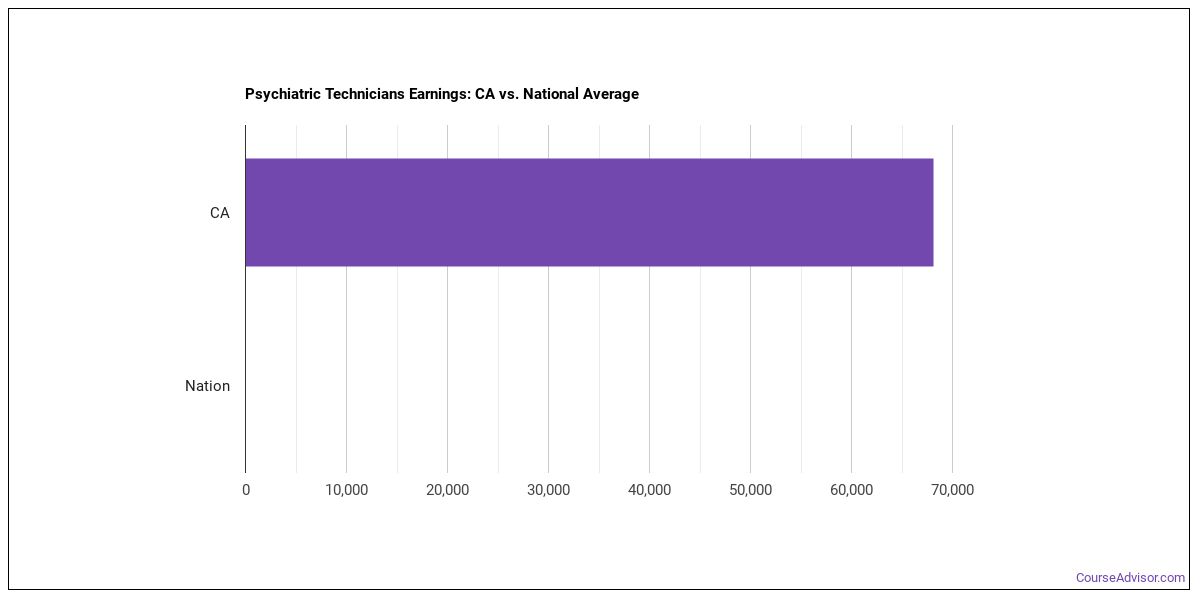
What do Psychiatric Technicians Make in California?
For psychiatric technicians working in California, the typical annual salary is $61,620 per year (or roughly $29.63/hour).Pay can range from $41,160 at the 10th percentile to $91,910 at the 90th percentile.
| Wage Statistic | Annual | Hourly |
|---|---|---|
| 10th percentile | $41,160 | $19.79 |
| 25th percentile | $44,880 | $21.58 |
| Median (50th) | $61,620 | $29.63 |
| 75th percentile | $80,630 | $38.77 |
| 90th percentile | $91,910 | $44.19 |

Location quotient — how concentrated this career is in California compared to the national average — is 0.55, suggesting fewer psychiatric technicians per worker than the national average.
National Wage Comparison
Nationally, psychiatric technicians earn a median of $52,472 per year ($25.23/hour), higher than the California median.
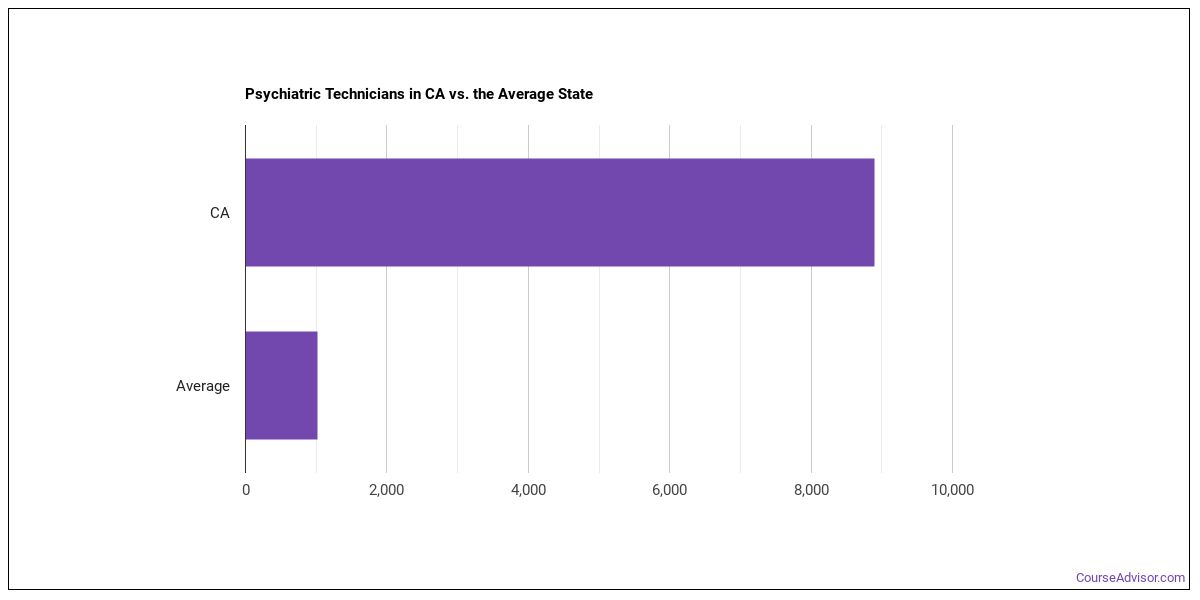
Employment Outlook
National employment for 450,959 psychiatric technicians across the United States. In California alone, approximately 8,830 people work in this role. That puts the state above the typical state, which employs around 1,630 psychiatric technicians.

Top California Metros for Psychiatric Technicians
The metro areas below employ the most psychiatric technicians in California.
| Metro Area | Number Employed | Annual Median Salary |
|---|---|---|
| Los Angeles-Long Beach-Anaheim, CA | 2,590 | $46,690 |
| Riverside-San Bernardino-Ontario, CA | 880 | $71,330 |
| San Francisco-Oakland-Fremont, CA | 750 | $70,370 |
| Sacramento-Roseville-Folsom, CA | 670 | $45,040 |
| Fresno, CA | 440 | $75,420 |
| San Diego-Chula Vista-Carlsbad, CA | 440 | $50,390 |
| Stockton-Lodi, CA | 370 | $91,910 |
| Visalia, CA | 260 | $77,340 |
| Vallejo, CA | 210 | $82,170 |
| San Jose-Sunnyvale-Santa Clara, CA | 170 | $53,270 |
| Yuba City, CA | 150 | $41,160 |
| Santa Rosa-Petaluma, CA | 60 | $82,440 |
| Santa Maria-Santa Barbara, CA | 50 | $71,090 |
| El Centro, CA | 40 | $58,310 |
Top States for Psychiatric Technicians Employment
View the states that employ the most psychiatric technicians work.
| State | Number Employed |
|---|---|
| Florida | 14,080 |
| Texas | 11,530 |
| California | 8,830 |
| Pennsylvania | 7,790 |
| Arizona | 7,510 |
| Illinois | 6,770 |
| Indiana | 6,630 |
| Michigan | 5,060 |
| North Carolina | 4,940 |
| Missouri | 4,650 |
| Wisconsin | 4,360 |
| Virginia | 4,350 |
| Georgia | 3,920 |
| Massachusetts | 3,600 |
| Tennessee | 3,490 |
| Alabama | 2,860 |
| Ohio | 2,590 |
| Minnesota | 2,080 |
| New Jersey | 2,010 |
| Kansas | 1,990 |
Highest-Paying States for Psychiatric Technicians
The highest-paying states for psychiatric technicians.
| State | Annual Median Salary |
|---|---|
| District of Columbia | $65,060 |
| California | $61,620 |
| New Jersey | $58,000 |
| New York | $57,630 |
| Massachusetts | $52,290 |
| Hawaii | $52,180 |
| Oregon | $51,640 |
| Washington | $51,000 |
| Connecticut | $50,170 |
| Alaska | $49,340 |
Skills
The most important psychiatric technicians skills, rated on an importance scale of 0 to 5:
Knowledge Areas
Core knowledge areas for this occupation, rated on an importance scale of 0 to 5:
Abilities
Top abilities for psychiatric technicians, rated on an importance scale of 0 to 5:
Daily Tasks
Psychiatric Technicians typically:
- Provide nursing, psychiatric, or personal care to patients with cognitive, intellectual, or developmental disabilities.
- Encourage patients to develop work skills and to participate in social, recreational, or other therapeutic activities that enhance interpersonal skills or develop social relationships.
- Restrain violent, potentially violent, or suicidal patients by verbal or physical means as required.
- Lead prescribed individual or group therapy sessions as part of specific therapeutic procedures.
- Monitor patients' physical and emotional well-being and report unusual behavior or physical ailments to medical staff.
- Take and record measures of patients' physical condition, using devices such as thermometers or blood pressure gauges.
- Observe and influence patients' behavior, communicating and interacting with them and teaching, counseling, or befriending them.
- Aid patients in performing tasks, such as bathing or keeping beds, clothing, or living areas clean.
- Collaborate with or assist doctors, psychologists, or rehabilitation therapists in working with patients with cognitive, intellectual, or developmental disabilities to treat, rehabilitate, and return patients to the community.
- Develop or teach strategies to promote client wellness and independence.
- Train or instruct new employees on procedures to follow with psychiatric patients.
- Escort patients to medical appointments.
Work Activities
- Assisting and Caring for Others
- Communicating with Supervisors, Peers, or Subordinates
- Resolving Conflicts and Negotiating with Others
- Identifying Objects, Actions, and Events
- Getting Information
- Documenting/Recording Information
- Establishing and Maintaining Interpersonal Relationships
- Organizing, Planning, and Prioritizing Work
- Monitoring Processes, Materials, or Surroundings
- Making Decisions and Solving Problems
- Developing and Building Teams
- Evaluating Information to Determine Compliance with Standards
Tools & Technology
Software and systems commonly involved: Hot technologies: Microsoft Excel
What Major Will Prepare You For This Career?
Programs that train for this career include:
- Mental & Social Health Services
Featured schools near , edit
Related Careers
Careers similar to psychiatric technicians include:
- Clinical and Counseling Psychologists
- Mental Health Counselors
- Mental Health and Substance Abuse Social Workers
- Occupational Therapists
- Physical Therapists
- Recreational Therapists
Also Known As
Autism Behavior Technician (Autism Behavior Tech), BHT (Behavioral Health Technician), Behavior Technician (Behavior Tech), Behavioral Health Associate, Behavioral Technician (Behavioral Tech), Counselor, Health Care Technician (Health Care Tech), LPT (Licensed Psychiatric Technician), MHA (Mental Health Assistant), MHW (Mental Health Worker), Mental Health Associate, Mental Health Specialist, Mental Health Technician (MHT), Milieu Therapist, Patient Care Specialist.
References
- U.S. Bureau of Labor Statistics, Occupational Employment and Wage Statistics — https://www.bls.gov/oes/
- O*NET Online — https://www.onetonline.org/
- BLS Employment Projections — https://www.bls.gov/emp/
- O*NET-SOC code: 29-2053.00
Course Advisor provides higher-education, college and university, degree, program, career, salary, and other helpful information to students, faculty, institutions, and other internet audiences. Presented information and data are subject to change. Inclusion on this website does not imply or represent a direct relationship with the company, school, or brand. Information, though believed correct at time of publication, may not be correct, and no warranty is provided. Contact the schools to verify any information before relying on it. Financial aid may be available for those who qualify. The displayed options may include sponsored or recommended results, not necessarily based on your preferences.
© Course Advisor – All Rights Reserved.