Plant and System Operators, All Other in California
Want to work as a Plant and System Operators, All Other in California? Here’s what you need to know. All plant and system operators not listed separately.
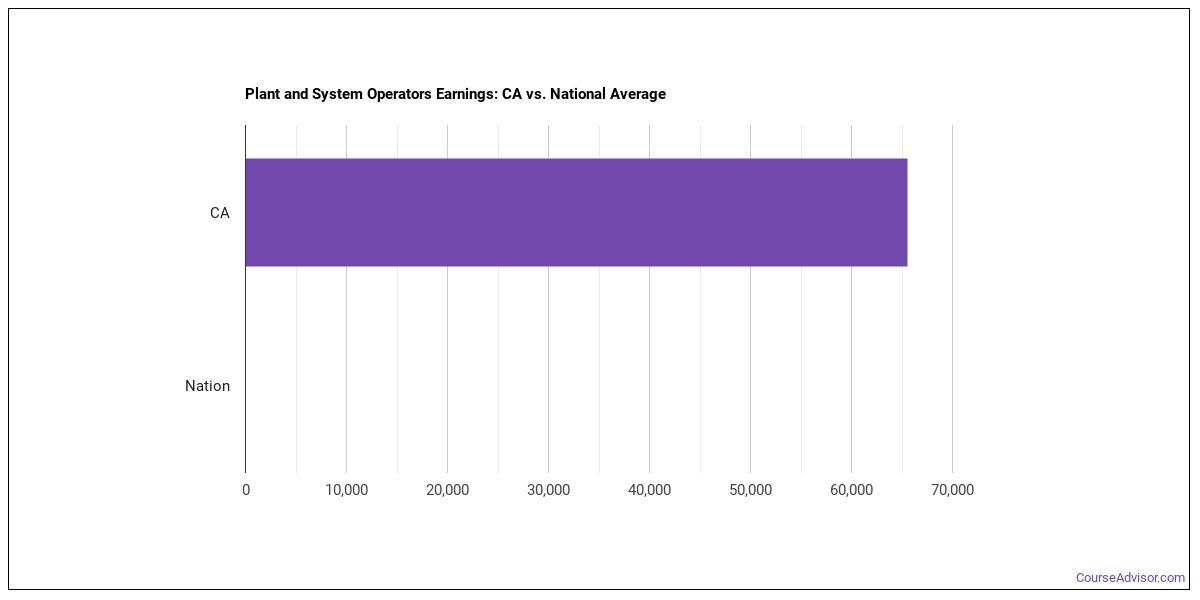
What do Plant and System Operators, All Other Make in California?
The plant and system operators, all other working in California, the typical annual salary is $73,950 per year (or roughly $35.55/hour).Earnings range from $45,040 at the 10th percentile to $101,800 at the 90th percentile.
| Wage Statistic | Annual | Hourly |
|---|---|---|
| 10th percentile | $45,040 | $21.65 |
| 25th percentile | $60,210 | $28.95 |
| Median (50th) | $73,950 | $35.55 |
| 75th percentile | $82,610 | $39.72 |
| 90th percentile | $101,800 | $48.94 |

The location quotient — a measure of how concentrated this occupation is in California relative to the national average — is 1.07.
National Wage Comparison
Nationally, plant and system operators, all other earn a median of $49,765 per year ($23.93/hour), above the California median.
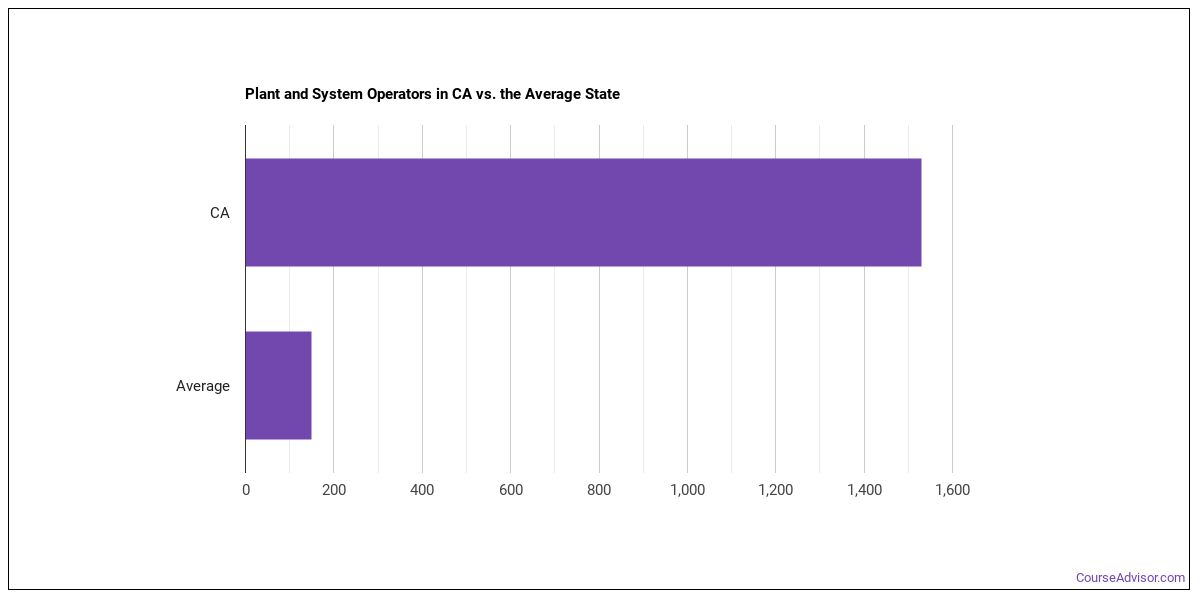
Employment Outlook
There are roughly 164,383 plant and system operators, all other nationwide. In California alone, about 2,000 people work in this role. That puts the state above the typical state, which employs around 170 plant and system operators, all other.

Top California Metros for Plant and System Operators, All Other
The metro areas below employ the most plant and system operators, all other in California.
| Metro Area | Number Employed | Annual Median Salary |
|---|---|---|
| Los Angeles-Long Beach-Anaheim, CA | 510 | $71,030 |
| Riverside-San Bernardino-Ontario, CA | 310 | $78,540 |
| San Francisco-Oakland-Fremont, CA | 270 | $84,840 |
| San Diego-Chula Vista-Carlsbad, CA | 200 | $74,830 |
| Oxnard-Thousand Oaks-Ventura, CA | 120 | $45,750 |
| Sacramento-Roseville-Folsom, CA | 90 | $78,770 |
| Bakersfield-Delano, CA | 60 | $73,950 |
| Fresno, CA | 60 | $64,770 |
| Modesto, CA | 30 | $80,930 |
Top States for Plant and System Operators, All Other Employment
The table below shows the states where the most plant and system operators, all other work.
| State | Number Employed |
|---|---|
| Texas | 4,080 |
| California | 2,000 |
| Colorado | 1,360 |
| Florida | 660 |
| Georgia | 610 |
| Pennsylvania | 510 |
| Louisiana | 480 |
| New Jersey | 380 |
| New York | 340 |
| Indiana | 330 |
| Michigan | 330 |
| Ohio | 270 |
| Virginia | 270 |
| Maryland | 260 |
| Nevada | 230 |
| Missouri | 230 |
| Minnesota | 220 |
| Illinois | 210 |
| Montana | 200 |
| South Dakota | 190 |
Highest-Paying States for Plant and System Operators, All Other
Where plant and system operators, all other earn the most: plant and system operators, all other.
| State | Annual Median Salary |
|---|---|
| Minnesota | $83,060 |
| Washington | $82,040 |
| Maryland | $80,080 |
| Montana | $78,850 |
| Alaska | $78,620 |
| Kentucky | $77,690 |
| New Jersey | $74,700 |
| California | $73,950 |
| Kansas | $73,170 |
| New York | $72,410 |
Also Known As
Asphalt Plant Operator, Batch Plant Operator, Batch and Furnace Operator, Batcher Operator, Bulk Plant Operator, Cement Boat and Barge Loader, Charge Machine Operator, Chief Lock Tender Operator, Coal Pipeline Operator, Concrete Batch Plant Operator, Control Board Operator, Fire Tender, Forming Process Worker, Garbage Stoker, High Pressure Firer.
References
- U.S. Bureau of Labor Statistics, Occupational Employment and Wage Statistics — https://www.bls.gov/oes/
- O*NET Online — https://www.onetonline.org/
- BLS Employment Projections — https://www.bls.gov/emp/
- O*NET-SOC code: 51-8099.00
Course Advisor provides higher-education, college and university, degree, program, career, salary, and other helpful information to students, faculty, institutions, and other internet audiences. Presented information and data are subject to change. Inclusion on this website does not imply or represent a direct relationship with the company, school, or brand. Information, though believed correct at time of publication, may not be correct, and no warranty is provided. Contact the schools to verify any information before relying on it. Financial aid may be available for those who qualify. The displayed options may include sponsored or recommended results, not necessarily based on your preferences.
© Course Advisor – All Rights Reserved.