Physicians and Surgeons in Massachusetts
Get the information you need to know about working as a Physician or Surgeon.
You’re in luck! Jobs for Physicians and Surgeons in Massachusetts are projected to grow and these jobs tend to pay higher than average.
-
Projected employment for Physicians and Surgeons in Massachusetts is growing faster than average.
-
Physicians and Surgeons in Massachusetts earn higher salaries than the typical U.S. wage earner.
Featured schools near , edit
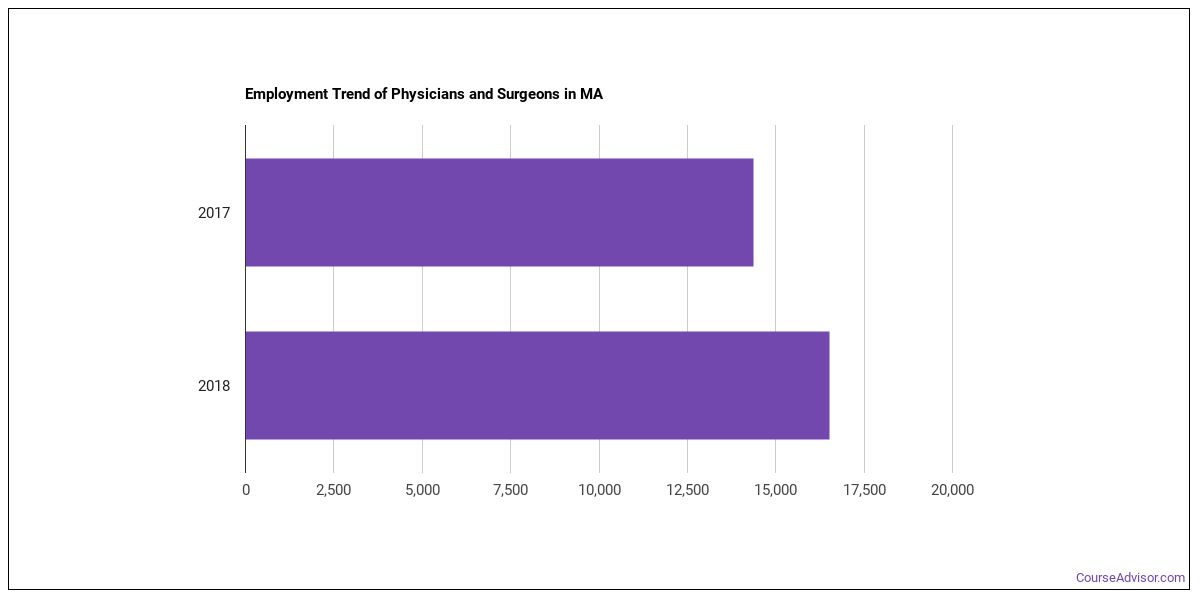
How Many Physicians and Surgeons Work in Massachusetts?
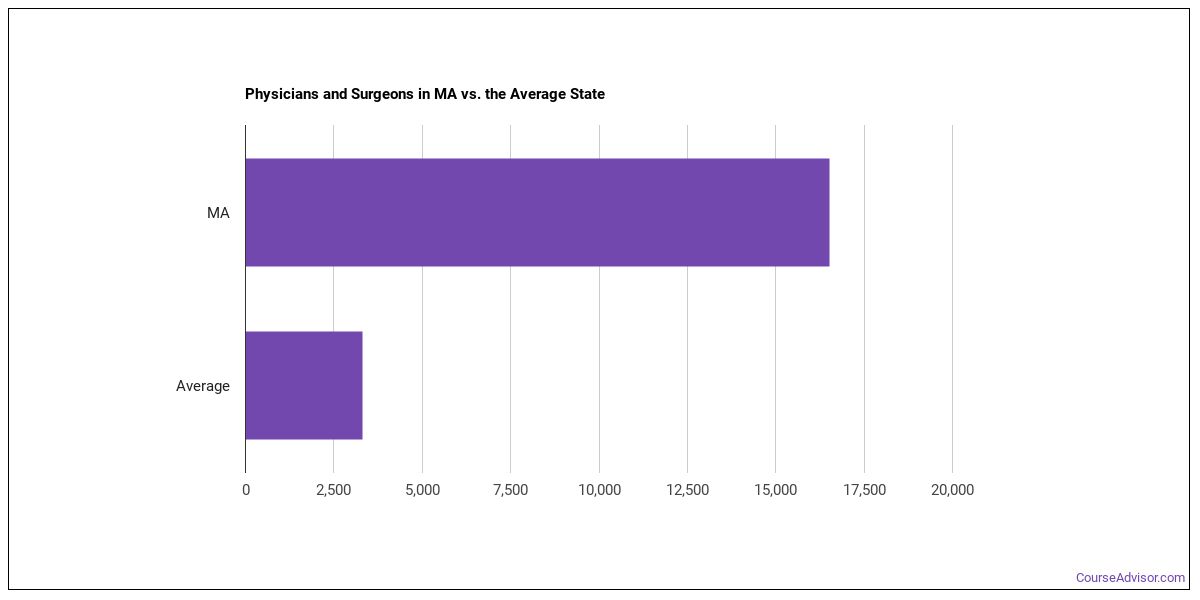
16,530 people worked as Physicians and Surgeons in 2018 in this state.
There were 14,370 Physicians and Surgeons employed in this state in 2017.
That’s growth of 2,160 jobs between 2017 and 2018.
The typical state has 3,320 Physicians and Surgeons working in it, which means Massachusetts has more Physicians and Surgeons than average.
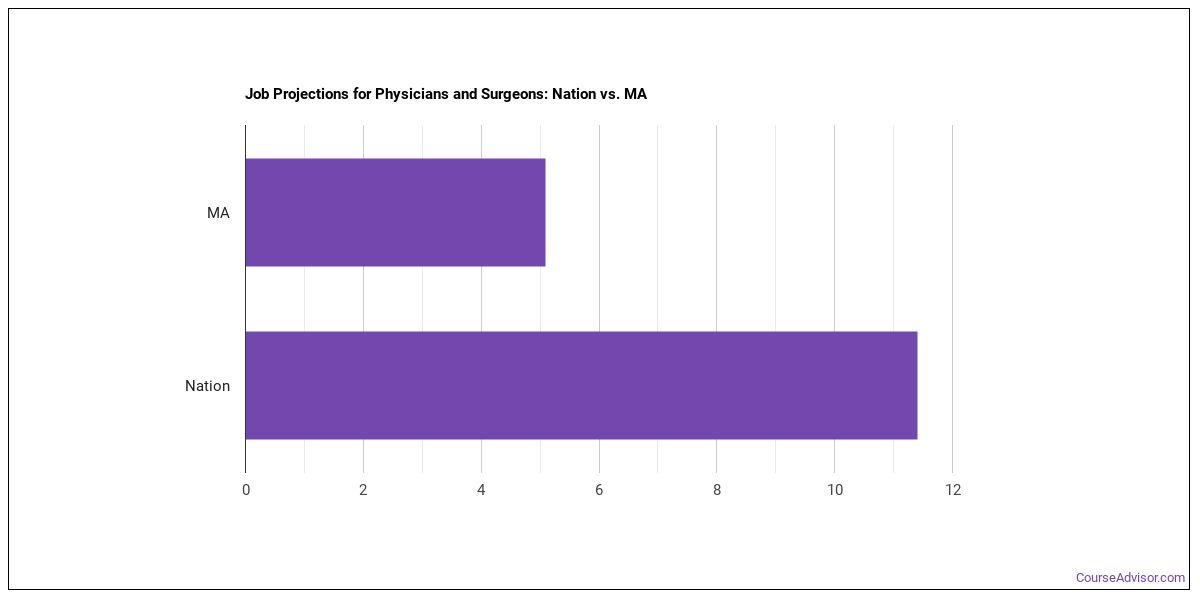
Job Projections for Massachusetts
Jobs for Physicians and Surgeons in this state are growing at a rate of 5.1% which is slower than the nationwide estimated projection of 11.4%.
Massachusetts Annual Job Openings
The BLS is projecting 480 annual Physicians and Surgeons job openings in Massachusetts, and 16,040 total jobs in the year 2026.
Nationwide, the prediction is 14,300 annual jobs and 414,700 total jobs in 2026.
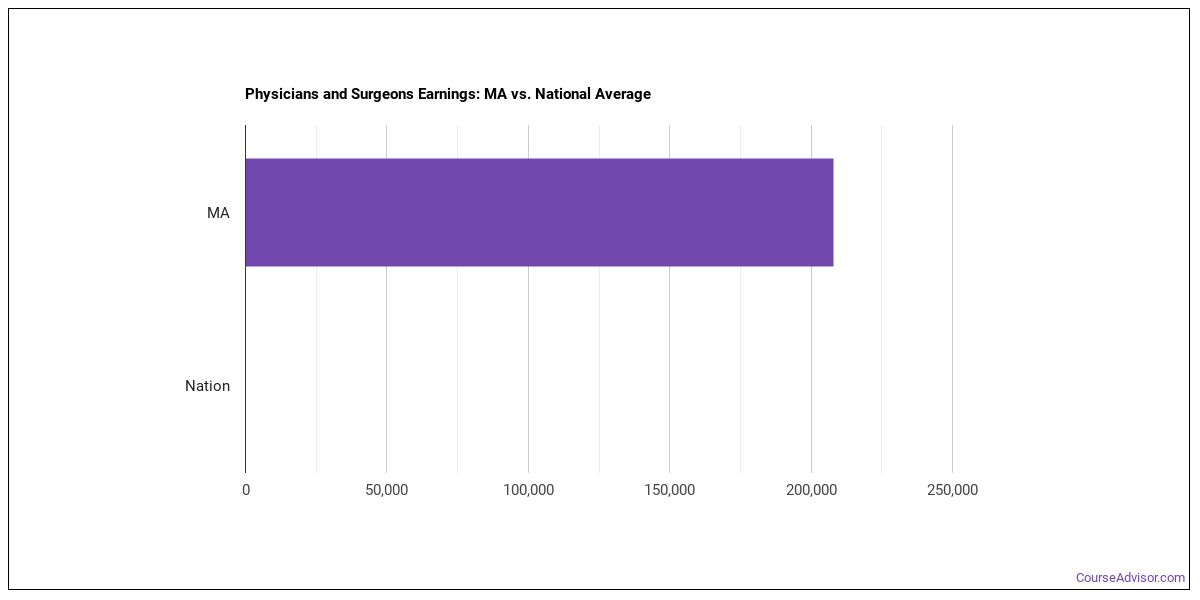
What do Physicians and Surgeons Make in Massachusetts?
In 2018 wages for Physicians and Surgeons ranged from $66,070 to $208,000 with $208,000 being the median annual salary.
Broken down to an hourly rate, workers in this field made anywhere from $31.76 to $100. The median hourly rate was $100.
Workers in this field were paid a median of $97.21 an hour in 2017.
The hourly rate grew by $2.79.
The median salary in Massachusetts is higher than the nationwide median salary.
Top Massachusetts Metros for Physicians and Surgeons
The table below shows some of the metros in this state with the most Physicians and Surgeons.
| Metro | Number Employed | Annual Median Salary |
|---|---|---|
| Boston-Cambridge-Nashua, MA-NH | 14,310 | $204,290 |
| Providence-Warwick, RI-MA | 2,630 | $205,810 |
| Worcester, MA-CT | 680 | $187,880 |
| Springfield, MA-CT | 620 | $208,000 |
| Barnstable Town, MA | 290 | $208,000 |
| Pittsfield, MA | 130 | $208,000 |
| Leominster-Gardner, MA | 110 | $208,000 |
Top States for Physicians and Surgeons Employment
View the list below to see where most Physicians and Surgeons work.
| State | Number Employed | Annual Median Salary |
|---|---|---|
| New York | 44,830 | $139,710 |
| California | 34,070 | $204,190 |
| Texas | 23,430 | $195,630 |
| Florida | 22,320 | $197,710 |
| Pennsylvania | 21,200 | $187,440 |
| Ohio | 17,020 | $208,000 |
| Massachusetts | 16,530 | $208,000 |
| Michigan | 16,480 | $173,480 |
| New Jersey | 15,380 | $208,000 |
| North Carolina | 13,380 | $196,670 |
| Maryland | 12,170 | $182,970 |
| Indiana | 10,730 | $208,000 |
| Georgia | 10,690 | $208,000 |
| Illinois | 9,940 | $160,050 |
| Virginia | 9,630 | $201,770 |
| Washington | 8,260 | $208,000 |
| Wisconsin | 7,050 | $208,000 |
| Connecticut | 6,970 | $208,000 |
| Tennessee | 6,100 | $208,000 |
| Oregon | 5,650 | $199,960 |
Below are the states where Physicians and Surgeons get paid the most:
| State | Annual Median Salary |
|---|---|
| Montana | $208,000 |
| Alaska | $208,000 |
| Arizona | $208,000 |
| Wisconsin | $208,000 |
| West Virginia | $208,000 |
| Colorado | $208,000 |
| Connecticut | $208,000 |
| Delaware | $208,000 |
| Washington | $208,000 |
| Utah | $208,000 |
Related Careers in MA
Discover similar careers:
| Occupation | MA Employment Total |
|---|
References
- Bureau of Labor Statistics (BLS)
- College Factual
- National Center for Education Statistics
- O*NET Online
More about our data sources and methodologies.
Featured Schools
 Request Info
|
Southern New Hampshire University You have goals. Southern New Hampshire University can help you get there. Whether you need a bachelor's degree to get into a career or want a master's degree to move up in your current career, SNHU has an online program for you. Find your degree from over 200 online programs. Learn More > |
Course Advisor provides higher-education, college and university, degree, program, career, salary, and other helpful information to students, faculty, institutions, and other internet audiences. Presented information and data are subject to change. Inclusion on this website does not imply or represent a direct relationship with the company, school, or brand. Information, though believed correct at time of publication, may not be correct, and no warranty is provided. Contact the schools to verify any information before relying on it. Financial aid may be available for those who qualify. The displayed options may include sponsored or recommended results, not necessarily based on your preferences.
© Course Advisor – All Rights Reserved.