Physical Scientists, All Other: Job Description
All physical scientists not listed separately.
Featured schools near , edit
What Do Physical Scientists, All Other Take On?
Types of Physical Scientists, All Other Jobs
Common job titles for this role include:
- Inventor
- Physical Scientist
- Research Scientist
- Wood Technologist
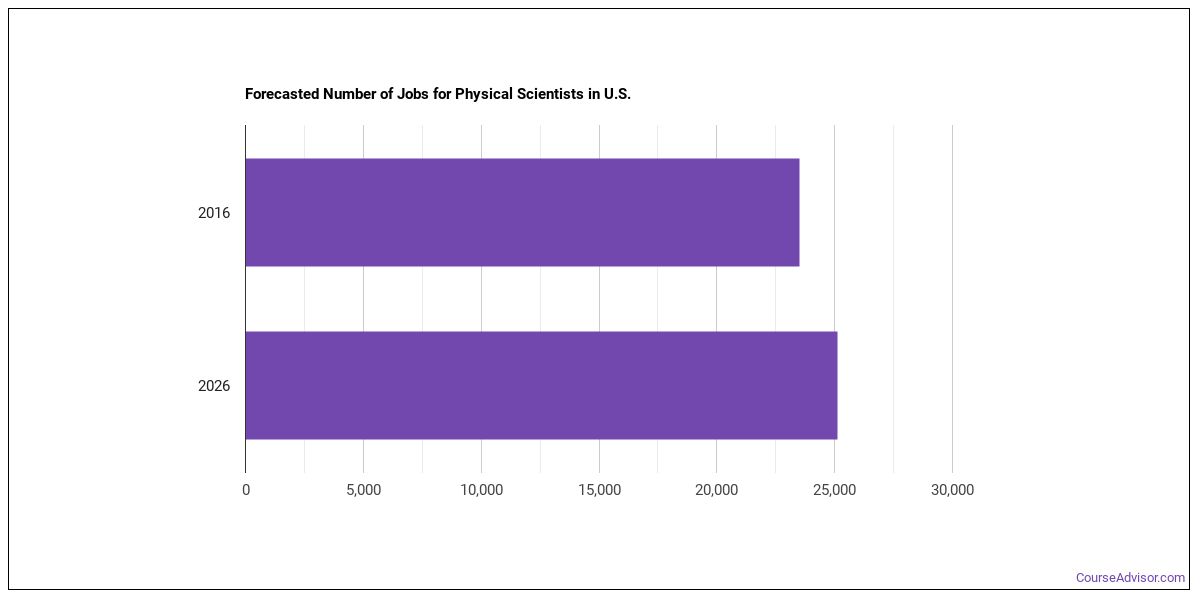
How Many Physical Scientists, All Other Are There?
There are about 84,392 physical scientists, all other working in the United States today. This occupation is expected to grow by +5.3% over the projection horizon.
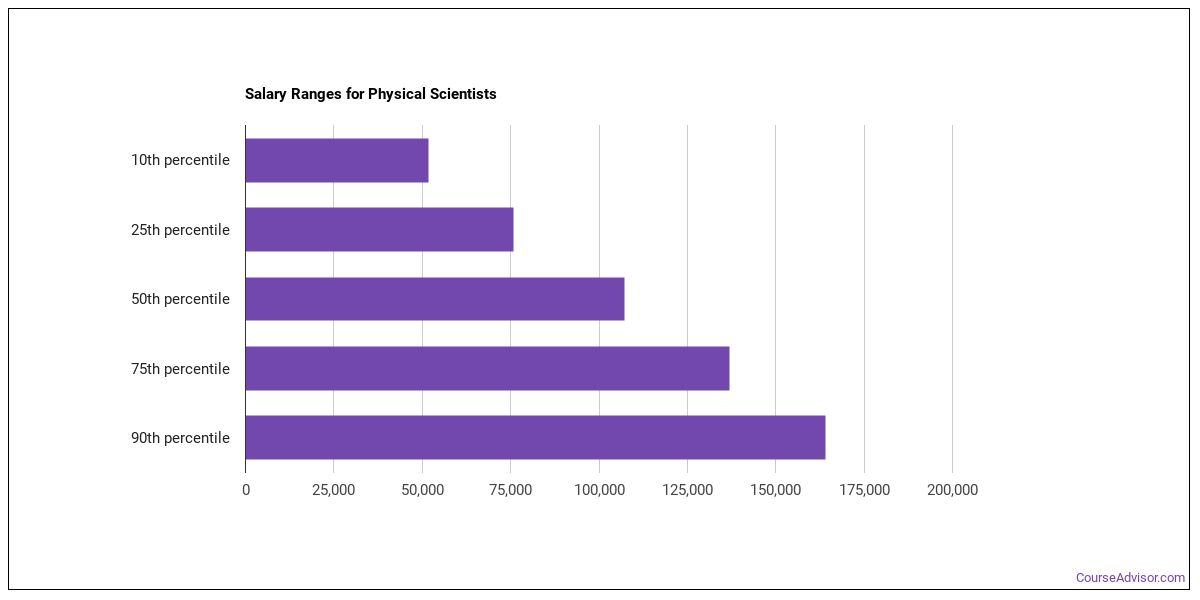
Salary for Physical Scientists, All Other
| Statistic | Value |
|---|---|
| Annual median | $72,607 |
| Hourly median | $34.91 |
| 10th percentile | $45,912 |
| 25th percentile | $59,260 |
| 75th percentile | $85,955 |
| 90th percentile | $99,303 |
Wages vary widely based on experience, location, and industry.
How Much Do Physical Scientists, All Other Make in Different U.S. States?
| State | Annual median salary |
|---|---|
| Minnesota | $167,110 |
| District of Columbia | $157,980 |
| Massachusetts | $143,640 |
| Maryland | $143,210 |
| North Dakota | $138,430 |
| Washington | $135,080 |
| South Carolina | $134,430 |
| Georgia | $131,770 |
| Alabama | $131,560 |
| Colorado | $130,290 |
| California | $128,250 |
| Virginia | $128,040 |
| New Mexico | $127,090 |
| Florida | $122,600 |
| Arizona | $119,920 |
| Kansas | $114,820 |
| New York | $114,430 |
| Alaska | $114,120 |
| Tennessee | $113,730 |
| North Carolina | $111,490 |
| Hawaii | $111,380 |
| Missouri | $111,170 |
| Oklahoma | $110,300 |
| Oregon | $109,120 |
| Illinois | $108,630 |
| Utah | $106,850 |
| Mississippi | $105,500 |
| Michigan | $105,480 |
| Ohio | $102,750 |
| New Jersey | $102,350 |
| Nebraska | $99,490 |
| Pennsylvania | $98,860 |
| Texas | $98,460 |
| Wisconsin | $93,910 |
| Idaho | $89,860 |
| Montana | $85,160 |
| New Hampshire | $85,030 |
| Kentucky | $80,870 |
| Iowa | $79,790 |
| Louisiana | $74,990 |
| Wyoming | $65,960 |
| Indiana | $64,300 |
| Puerto Rico | $51,530 |
Top-Paying U.S. Regions
Compensation for physical scientists, all other differ across the country. The following regions pay the most:
| Region | Median annual wage | Share of U.S. jobs | Location quotient |
|---|---|---|---|
| Plains States | $147,425 | 4.1% | 1.07 |
| Middle Atlantic | $126,655 | 26.6% | 3.33 |
| Far Western US | $126,507 | 14.8% | 1.04 |
| Rocky Mountains | $116,450 | 5.7% | 1.68 |
| Southeast | $115,615 | 22.7% | 1.59 |
| New England | $111,882 | 3.9% | 1.40 |
| Southwest | $103,415 | 10.4% | 0.94 |
| Great Lakes | $85,406 | 11.6% | 1.57 |
Top Metro Areas
| Metro area | State | Median annual wage | Employment |
|---|---|---|---|
| San Jose-Sunnyvale-Santa Clara, CA | CA | $174,810 | 300 |
| Providence-Warwick, RI-MA | RI | $170,960 | 100 |
| Minneapolis-St. Paul-Bloomington, MN-WI | MN | $168,870 | 540 |
| Washington-Arlington-Alexandria, DC-VA-MD-WV | DC | $162,610 | 2,720 |
| Palm Bay-Melbourne-Titusville, FL | FL | $155,080 | 80 |
| Santa Maria-Santa Barbara, CA | CA | $147,320 | 30 |
| Bremerton-Silverdale-Port Orchard, WA | WA | $142,810 | 30 |
| Boston-Cambridge-Newton, MA-NH | MA | $141,980 | 520 |
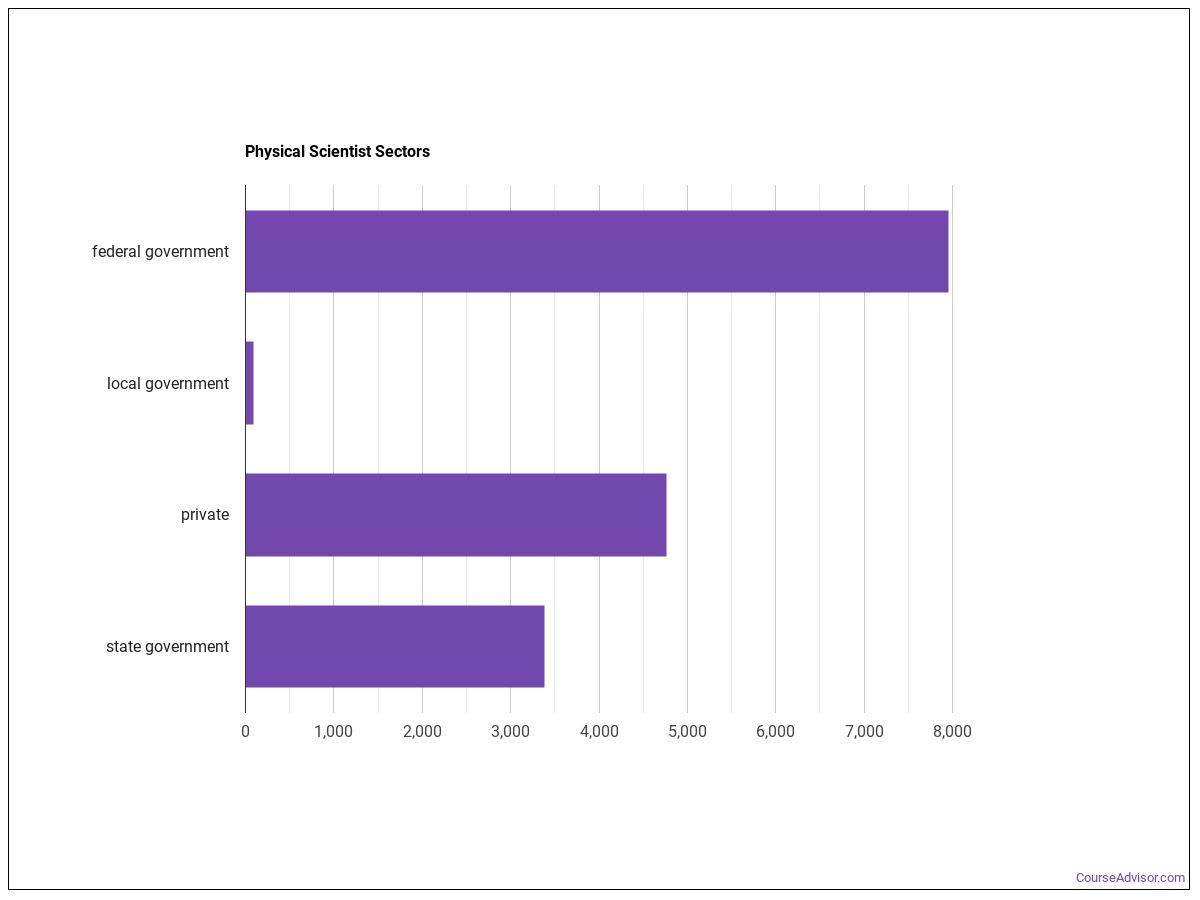
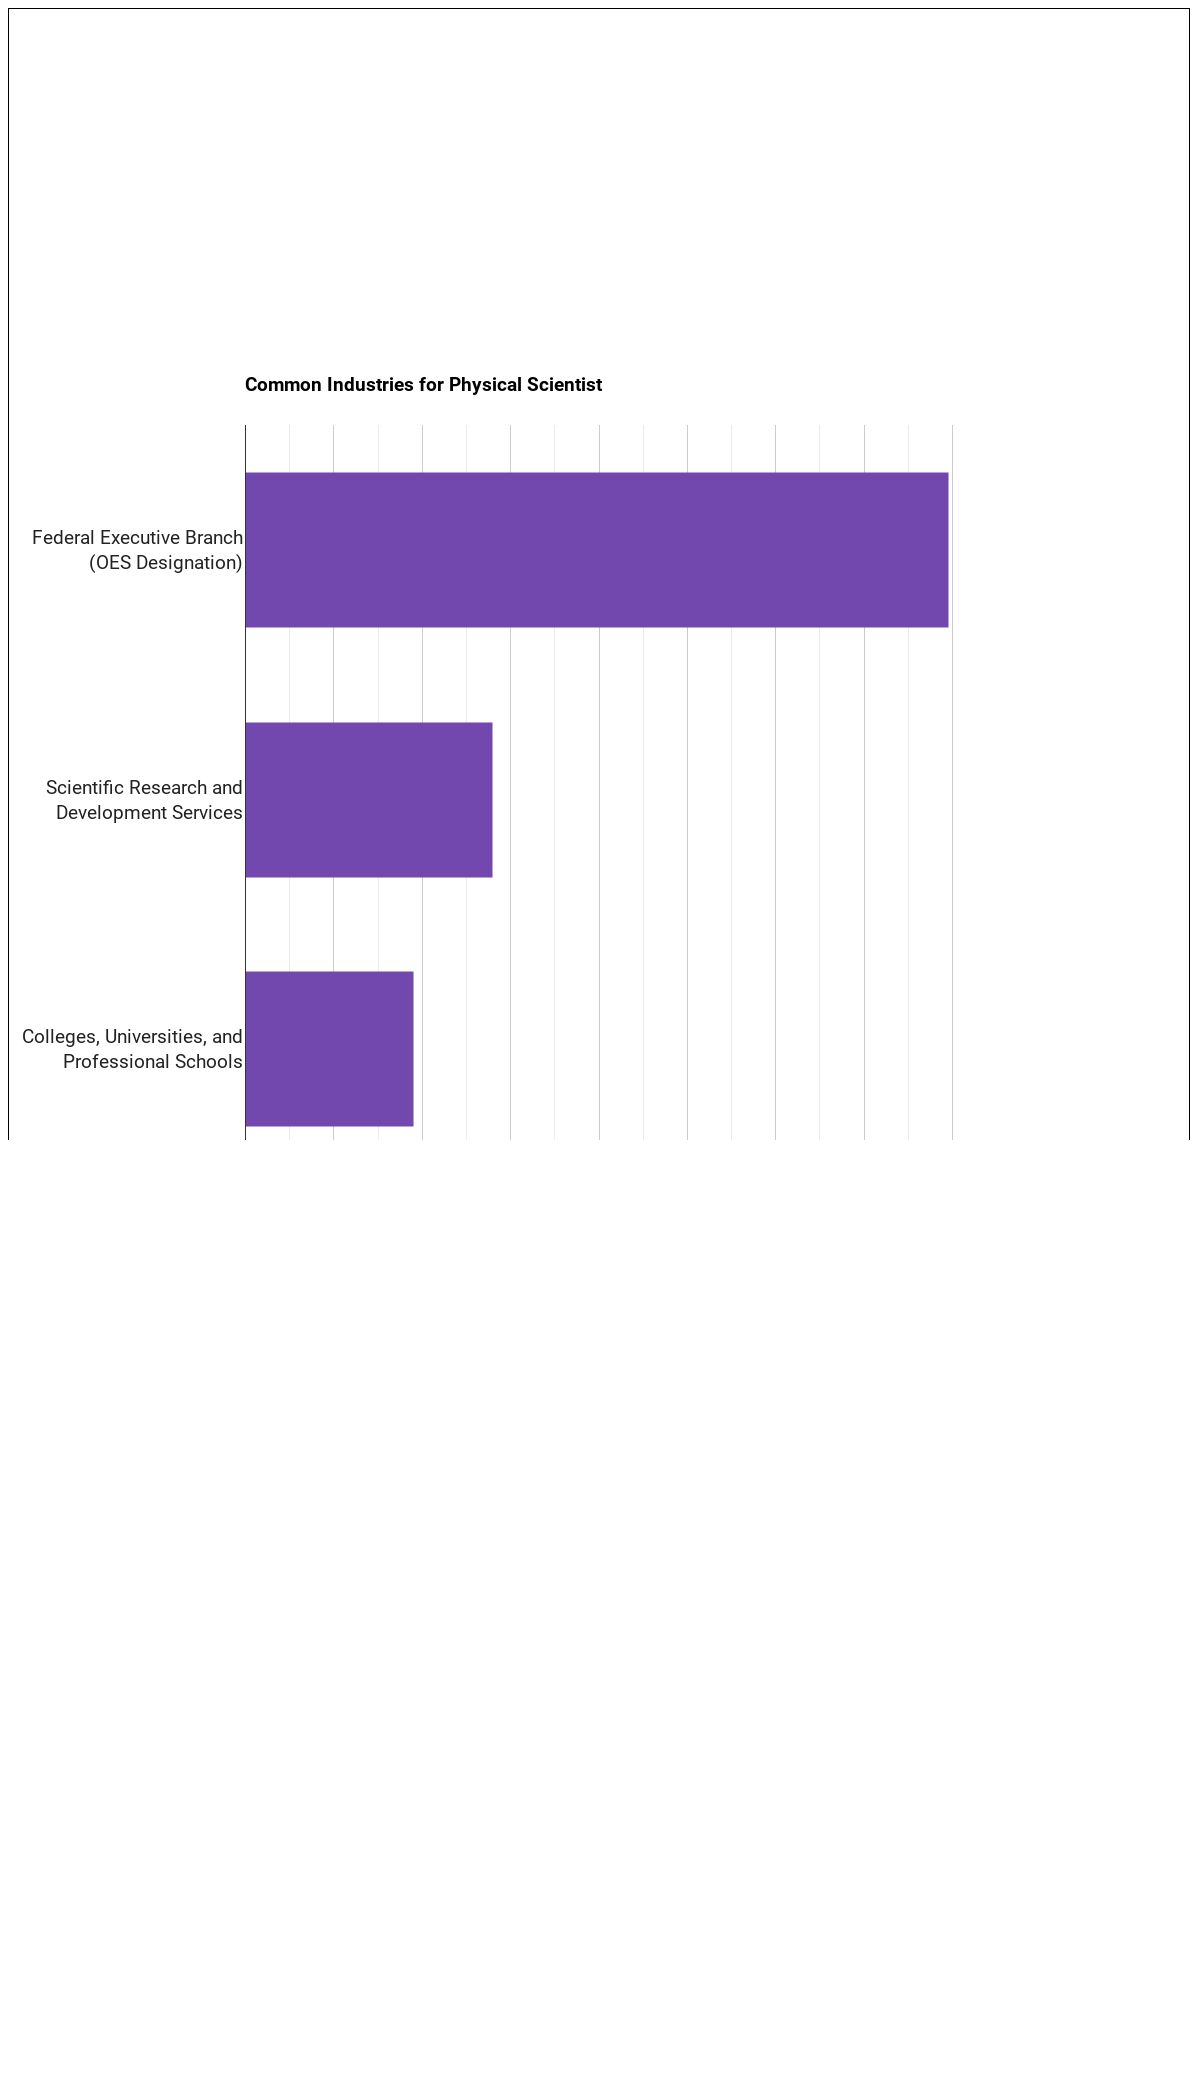
Top Industries Employing Physical Scientists, All Other
Most physical scientists, all other are concentrated in the following sectors:
| Industry | Employment | Median annual wage |
|---|---|---|
| Professional, Scientific, and Technical Services | 4,280 | $121,490 |
| Educational Services | 3,700 | $80,130 |
| Manufacturing | 1,300 | $145,640 |
| Management of Companies and Enterprises | 490 | $168,290 |
| Administrative and Support and Waste Management and Remediation Services | 220 | $122,660 |
| Utilities | 120 | $101,560 |
| Health Care and Social Assistance | 40 | $90,920 |
| Other Services (except Public Administration) | 40 | $114,790 |
The table below shows some of the most common industries where those employed in this career field work.
Where to Study
Future physical scientists, all other commonly pursue programs in:
Multi/Interdisciplinary Studies
2 programs across 2 majors
Physical Sciences
1 programs across 1 majors
References
Statistics shown above are sourced from the following authoritative sources:
- U.S. Bureau of Labor Statistics — Occupational Employment and Wage Statistics (OEWS) for employment and wage data by state and industry.
- BLS Employment Projections for total employment and growth forecasts.
- O*NET (Occupational Information Network) for skills, knowledge, tasks, work activities, work context, technology, and education-zone data.
SOC code: 19-2099.00 (Physical Scientists, All Other).
Course Advisor provides higher-education, college and university, degree, program, career, salary, and other helpful information to students, faculty, institutions, and other internet audiences. Presented information and data are subject to change. Inclusion on this website does not imply or represent a direct relationship with the company, school, or brand. Information, though believed correct at time of publication, may not be correct, and no warranty is provided. Contact the schools to verify any information before relying on it. Financial aid may be available for those who qualify. The displayed options may include sponsored or recommended results, not necessarily based on your preferences.
© Course Advisor – All Rights Reserved.