Office Machine Operators, Except Computer in Massachusetts
Considering working as an Office Machine Operators, Except Computer in Massachusetts? Here’s what you need to know. Operate one or more of a variety of office machines, such as photocopying, photographic, and duplicating machines, or other office machines. Excludes “Billing and Posting Clerks” (43-3021) and “Mail Clerks and Mail Machine Operators, Except Postal Service” (43-9051).
What do Office Machine Operators, Except Computer Make in Massachusetts?
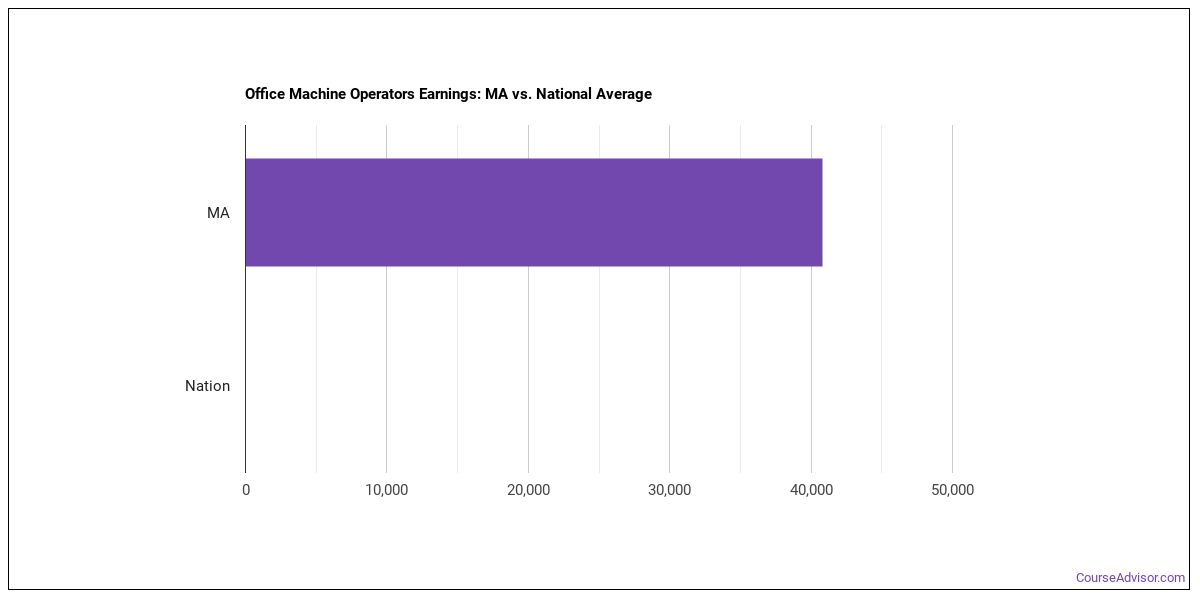
The office machine operators, except computer working in Massachusetts, the typical annual salary is $47,040 per year (or about $22.61/hour).Pay can range from $37,910 at the 10th percentile to $63,970 at the 90th percentile.
| Wage Statistic | Annual | Hourly |
|---|---|---|
| 10th percentile | $37,910 | $18.23 |
| 25th percentile | $42,680 | $20.52 |
| Median (50th) | $47,040 | $22.61 |
| 75th percentile | $55,480 | $26.67 |
| 90th percentile | $63,970 | $30.76 |

The location quotient — a measure of how concentrated this occupation is in Massachusetts compared to the national average — is 0.41, meaning fewer office machine operators, except computer per worker than the national average.
National Wage Comparison
Nationally, office machine operators, except computer earn a median of $50,998 per year ($24.52/hour), below the Massachusetts median.
Employment Outlook
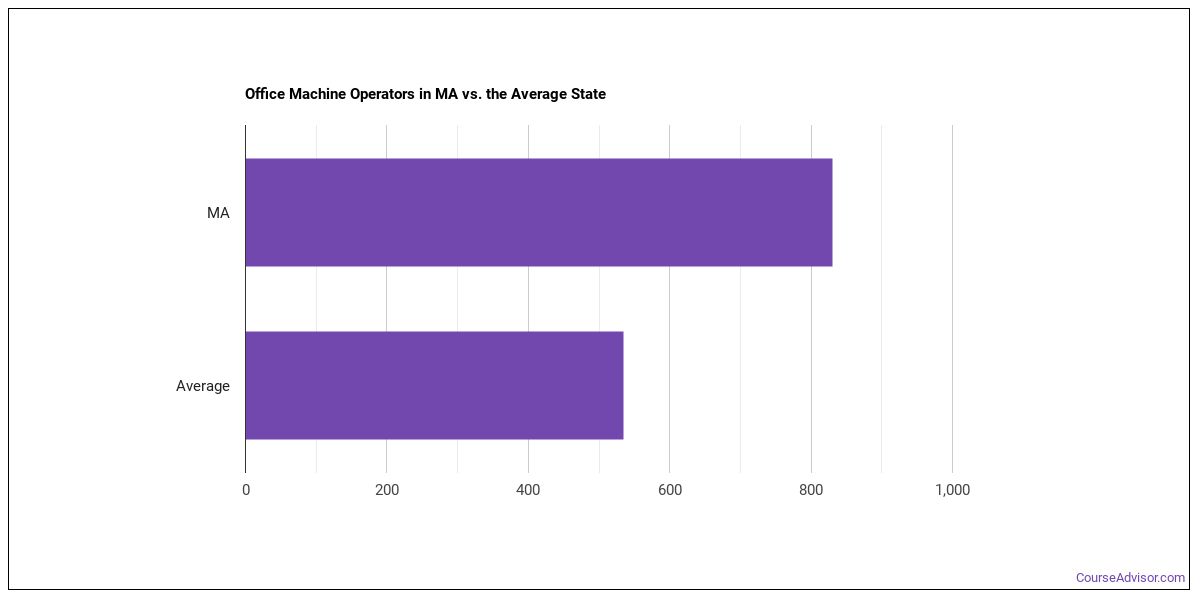
Nationally, total employment in this occupation is 288,692 office machine operators, except computer across the United States. In Massachusetts alone, approximately 240 people work in this role. That’s below the typical state, which employs around 250 office machine operators, except computer.

Top Massachusetts Metros for Office Machine Operators, Except Computer
The largest metro-area employers of office machine operators, except computer in Massachusetts.
| Metro Area | Number Employed | Annual Median Salary |
|---|---|---|
| Boston-Cambridge-Newton, MA-NH | 210 | $48,120 |
| Worcester, MA | 30 | $43,830 |
Top States for Office Machine Operators, Except Computer Employment
The table below shows the states where the most office machine operators, except computer work.
| State | Number Employed |
|---|---|
| California | 2,780 |
| New York | 2,480 |
| Texas | 2,150 |
| New Jersey | 1,620 |
| Florida | 1,150 |
| Minnesota | 1,020 |
| Missouri | 1,010 |
| Illinois | 910 |
| Pennsylvania | 880 |
| North Carolina | 770 |
| Georgia | 700 |
| Virginia | 660 |
| Washington | 590 |
| Indiana | 590 |
| Ohio | 580 |
| Michigan | 480 |
| Colorado | 400 |
| Wisconsin | 360 |
| Tennessee | 320 |
| Oregon | 310 |
Highest-Paying States for Office Machine Operators, Except Computer
The highest-paying states for office machine operators, except computer.
| State | Annual Median Salary |
|---|---|
| Alaska | $50,220 |
| Massachusetts | $47,040 |
| Maryland | $46,870 |
| Washington | $45,180 |
| California | $45,070 |
| West Virginia | $44,720 |
| District of Columbia | $44,650 |
| Illinois | $44,280 |
| Connecticut | $43,700 |
| Alabama | $43,310 |
Skills
Top office machine operators, except computer skills, rated on an importance scale of 0 to 5:
Knowledge Areas
Important knowledge areas for this occupation, rated on an importance scale of 0 to 5:
Abilities
Top abilities for office machine operators, except computer, rated on an importance scale of 0 to 5:
Daily Tasks
Office Machine Operators, Except Computer typically:
- Read job orders to determine the type of work to be done, the quantities to be produced, and the materials needed.
- Deliver completed work.
- Place original copies in feed trays, feed originals into feed rolls, or position originals on tables beneath camera lenses.
- Sort, assemble, and proof completed work.
- Operate office machines such as high speed business photocopiers, readers, scanners, addressing machines, stencil-cutting machines, microfilm readers or printers, folding and inserting machines, bursters, and binder machines.
- Complete records of production, including work volumes and outputs, materials used, and any backlogs.
- Compute prices for services and receive payment, or provide supervisors with billing information.
- Set up and adjust machines, regulating factors such as speed, ink flow, focus, and number of copies.
- Load machines with materials such as blank paper or film.
- Monitor machine operation, and make adjustments as necessary to ensure proper operation.
- Clean machines, perform minor repairs, and report major repair needs.
- File and store completed documents.
Work Activities
- Working with Computers
- Getting Information
- Organizing, Planning, and Prioritizing Work
- Communicating with Supervisors, Peers, or Subordinates
- Controlling Machines and Processes
- Processing Information
- Thinking Creatively
- Coordinating the Work and Activities of Others
- Updating and Using Relevant Knowledge
- Establishing and Maintaining Interpersonal Relationships
- Judging the Qualities of Objects, Services, or People
- Handling and Moving Objects
Tools & Technology
Technologies frequently used: Hot technologies: Adobe Acrobat, Adobe Illustrator
Related Careers
Other careers like office machine operators, except computer include:
- File Clerks
- Postal Service Mail Sorters, Processors, and Processing Machine Operators
- Production, Planning, and Expediting Clerks
- Shipping, Receiving, and Inventory Clerks
- Data Entry Keyers
- Mail Clerks and Mail Machine Operators, Except Postal Service
Also Known As
Braille Coder, Braille Duplicating Machine Operator, Business Machine Operator, Check Embosser, Check Writing Machine Operator, Clerical Offset Duplicating Machine Operator, Coin Machine Operator, Coin Rolling Machine Operator, Coin Wrapping Machine Operator, Collating Machine Operator, Collator Operator, Compotype Operator, Copy Associate, Copy Center Associate, Copy Center Clerk.
References
- U.S. Bureau of Labor Statistics, Occupational Employment and Wage Statistics — https://www.bls.gov/oes/
- O*NET Online — https://www.onetonline.org/
- BLS Employment Projections — https://www.bls.gov/emp/
- O*NET-SOC code: 43-9071.00
Course Advisor provides higher-education, college and university, degree, program, career, salary, and other helpful information to students, faculty, institutions, and other internet audiences. Presented information and data are subject to change. Inclusion on this website does not imply or represent a direct relationship with the company, school, or brand. Information, though believed correct at time of publication, may not be correct, and no warranty is provided. Contact the schools to verify any information before relying on it. Financial aid may be available for those who qualify. The displayed options may include sponsored or recommended results, not necessarily based on your preferences.
© Course Advisor – All Rights Reserved.