Machinists in Wyoming
Want to work as a Machinists in Wyoming? Below are the key facts. Set up and operate a variety of machine tools to produce precision parts and instruments out of metal. Includes precision instrument makers who fabricate, modify, or repair mechanical instruments. May also fabricate and modify parts to make or repair machine tools or maintain industrial machines, applying knowledge of mechanics, mathematics, metal properties, layout, and machining procedures. Machinists who primarily program or operate computer numerically controlled (CNC) equipment are classified in “Computer Numerically Controlled Tool Operators and Programmers” (51-9160).
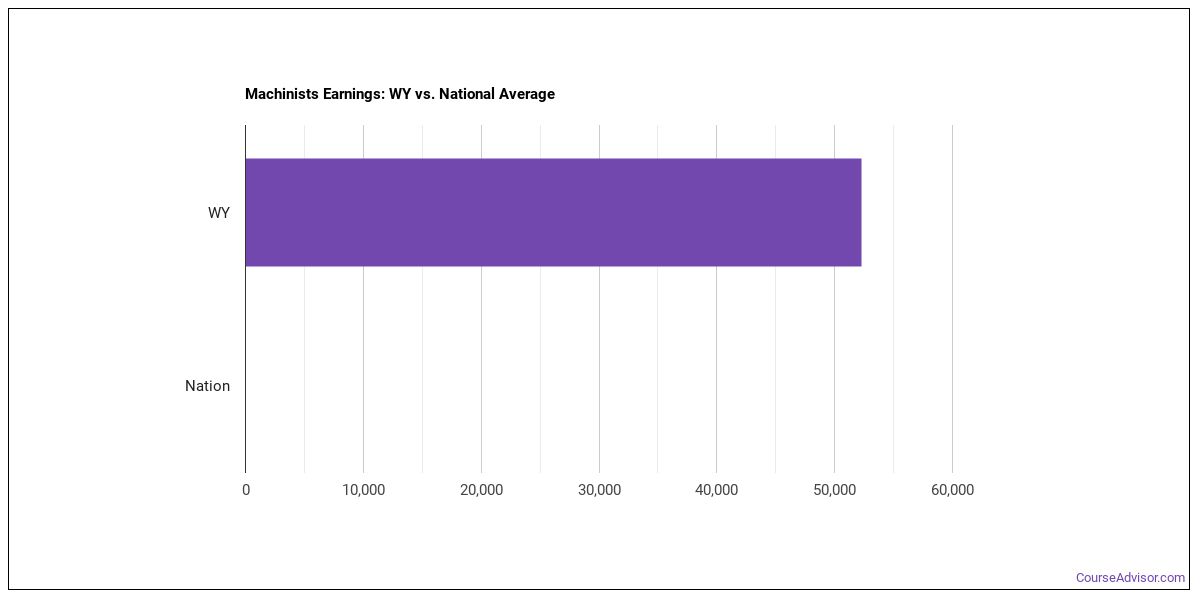
What do Machinists Make in Wyoming?
For a machinists working in Wyoming, wages run about $64,020 per year (or roughly $30.78/hour).Pay can range from $47,160 at the 10th percentile to $96,430 at the 90th percentile.
| Wage Statistic | Annual | Hourly |
|---|---|---|
| 10th percentile | $47,160 | $22.67 |
| 25th percentile | $51,660 | $24.84 |
| Median (50th) | $64,020 | $30.78 |
| 75th percentile | $82,880 | $39.85 |
| 90th percentile | $96,430 | $46.36 |

Location quotient — how concentrated this career is in Wyoming nationwide is 0.56, meaning fewer machinists per worker than the national average.
National Wage Comparison
Nationally, machinists earn a median of $58,269 per year ($28.01/hour), exceeding the Wyoming median.
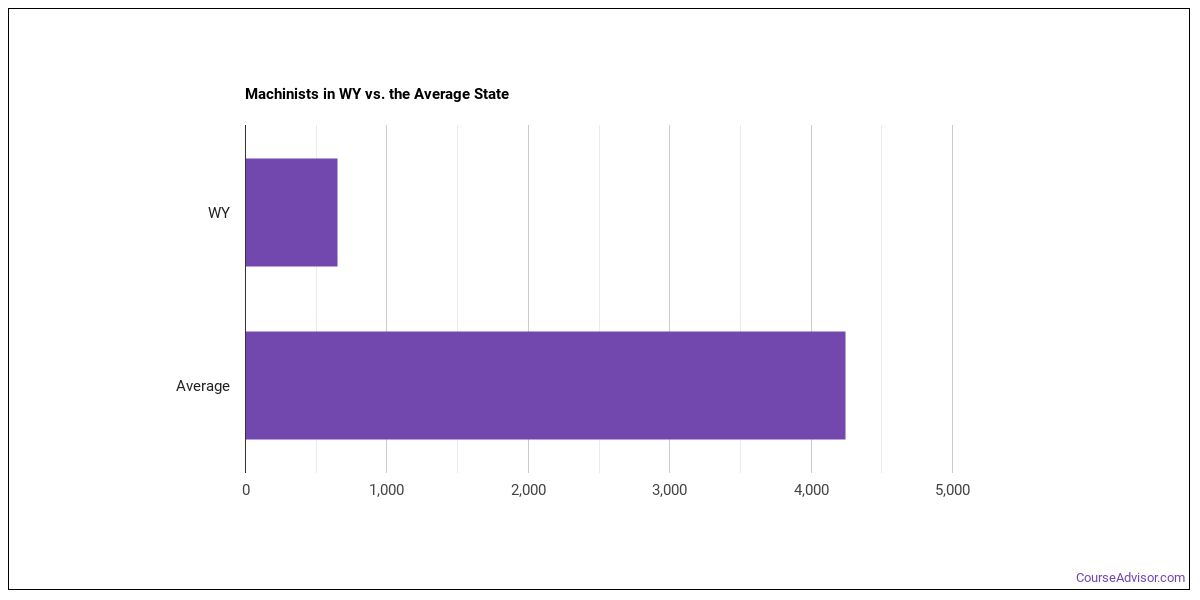
Employment Outlook
Nationally, total employment in this occupation is 813,435 machinists in the U.S.. In Wyoming alone, around 300 people work in this role. That’s fewer than the typical state, which employs around 4,020 machinists.

Top Wyoming Metros for Machinists
The metro areas below employ the most machinists in Wyoming.
| Metro Area | Number Employed | Annual Median Salary |
|---|---|---|
| Casper, WY | 120 | $61,140 |
Top States for Machinists Employment
The table below shows the states where the most machinists work.
| State | Number Employed |
|---|---|
| Michigan | 23,090 |
| California | 21,580 |
| Texas | 20,770 |
| Indiana | 16,510 |
| Illinois | 16,100 |
| Pennsylvania | 15,060 |
| Minnesota | 14,910 |
| Ohio | 14,110 |
| Wisconsin | 12,530 |
| New York | 8,870 |
| North Carolina | 8,310 |
| Florida | 8,240 |
| Missouri | 8,200 |
| Massachusetts | 7,870 |
| Tennessee | 7,730 |
| Washington | 6,980 |
| Georgia | 6,930 |
| Virginia | 6,140 |
| Connecticut | 6,070 |
| Alabama | 5,620 |
Highest-Paying States for Machinists
These states pay the most for machinists.
| State | Annual Median Salary |
|---|---|
| District of Columbia | $101,810 |
| Hawaii | $77,060 |
| Alaska | $72,710 |
| Washington | $64,510 |
| Wyoming | $64,020 |
| Massachusetts | $62,420 |
| Oregon | $62,120 |
| New Jersey | $62,010 |
| Maine | $61,950 |
| Montana | $61,230 |
Skills
Key machinists skills, rated on an importance scale of 0 to 5:
Knowledge Areas
Core knowledge areas for this occupation, rated on an importance scale of 0 to 5:
Abilities
The abilities that matter most for machinists, rated on an importance scale of 0 to 5:
Daily Tasks
Common tasks include:
- Calculate dimensions or tolerances, using instruments, such as micrometers or vernier calipers.
- Machine parts to specifications, using machine tools, such as lathes, milling machines, shapers, or grinders.
- Measure, examine, or test completed units to check for defects and ensure conformance to specifications, using precision instruments, such as micrometers.
- Set up, adjust, or operate basic or specialized machine tools used to perform precision machining operations.
- Program computers or electronic instruments, such as numerically controlled machine tools.
- Study sample parts, blueprints, drawings, or engineering information to determine methods or sequences of operations needed to fabricate products.
- Monitor the feed and speed of machines during the machining process.
- Maintain machine tools in proper operational condition.
- Fit and assemble parts to make or repair machine tools.
- Align and secure holding fixtures, cutting tools, attachments, accessories, or materials onto machines.
- Confer with numerical control programmers to check and ensure that new programs or machinery will function properly and that output will meet specifications.
- Operate equipment to verify operational efficiency.
Work Activities
- Controlling Machines and Processes
- Getting Information
- Inspecting Equipment, Structures, or Materials
- Identifying Objects, Actions, and Events
- Monitoring Processes, Materials, or Surroundings
- Repairing and Maintaining Mechanical Equipment
- Making Decisions and Solving Problems
- Communicating with Supervisors, Peers, or Subordinates
- Handling and Moving Objects
- Training and Teaching Others
- Processing Information
- Organizing, Planning, and Prioritizing Work
Tools & Technology
Common tools and software used in this occupation include: Hot technologies: Autodesk AutoCAD In-demand technologies: G-code
What Major Will Prepare You For This Career?
Related college programs include:
- Precision Metal Working
Featured schools near , edit
Related Careers
Careers similar to machinists include:
- Calibration Technologists and Technicians
- Industrial Machinery Mechanics
- Millwrights
- Aircraft Structure, Surfaces, Rigging, and Systems Assemblers
- Electrical and Electronic Equipment Assemblers
- Electromechanical Equipment Assemblers
Also Known As
Aircraft Machinist, Auto Machinist (Automotive Machinist), CNC Lathe Machinist (Computer Numeric Controlled Lathe Machinist), CNC Lathe Machinist (Computer Numerically Controlled Lathe Machinist), CNC Machinist (Computer Numeric Controlled Machinist), CNC Machinist (Computer Numerical Control Machinist), CNC Machinist (Computer Numerically Controlled Machinist), CNC Mill Machinist (Computer Numeric Controlled Mill Machinist), CNC Mill Machinist (Computer Numerically Controlled Mill Machinist), CNC Milling Machinist (Computer Numeric Control Milling Machinist), CNC Swiss Machinist (Computer Numeric Controlled Swiss Machinist), Carbide Operator, Conventional Machinist, Development Mechanic, Electrical Experimental Mechanic.
References
- U.S. Bureau of Labor Statistics, Occupational Employment and Wage Statistics — https://www.bls.gov/oes/
- O*NET Online — https://www.onetonline.org/
- BLS Employment Projections — https://www.bls.gov/emp/
- O*NET-SOC code: 51-4041.00
Course Advisor provides higher-education, college and university, degree, program, career, salary, and other helpful information to students, faculty, institutions, and other internet audiences. Presented information and data are subject to change. Inclusion on this website does not imply or represent a direct relationship with the company, school, or brand. Information, though believed correct at time of publication, may not be correct, and no warranty is provided. Contact the schools to verify any information before relying on it. Financial aid may be available for those who qualify. The displayed options may include sponsored or recommended results, not necessarily based on your preferences.
© Course Advisor – All Rights Reserved.