Gas Plant Operators in Ohio
Thinking about a career as a Gas Plant Operators in Ohio? Below are the key facts. Distribute or process gas for utility companies and others by controlling compressors to maintain specified pressures on main pipelines.
What do Gas Plant Operators Make in Ohio?
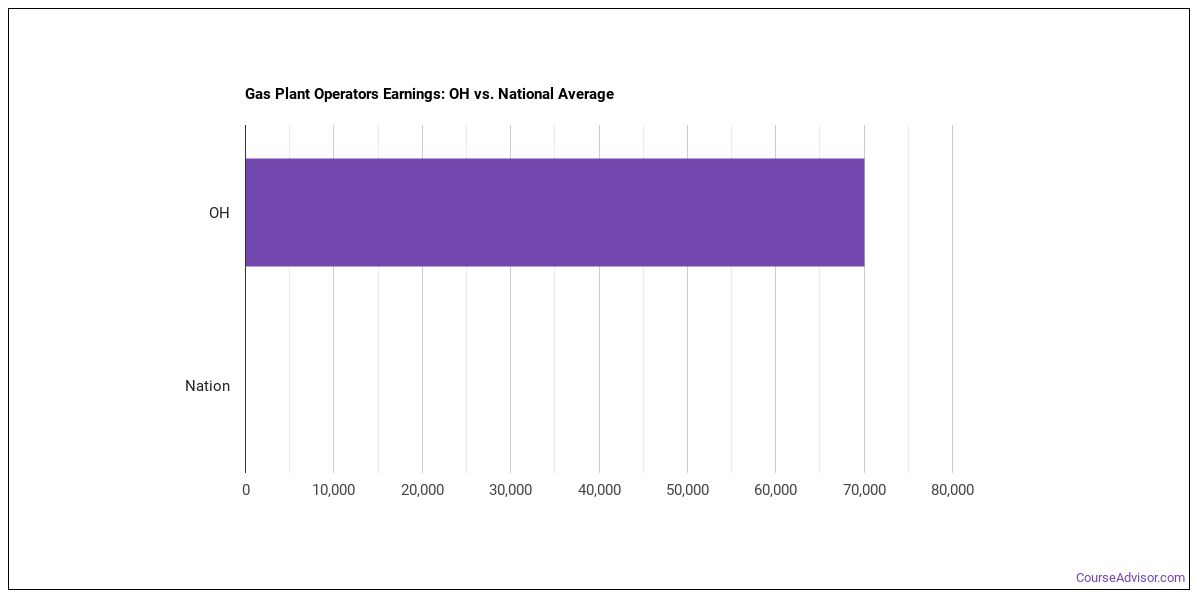
For gas plant operators working in Ohio, the median annual wage is $74,500 per year (or roughly $35.82/hour).Earnings range from $48,390 at the 10th percentile to $96,830 at the 90th percentile.
| Wage Statistic | Annual | Hourly |
|---|---|---|
| 10th percentile | $48,390 | $23.26 |
| 25th percentile | $56,210 | $27.02 |
| Median (50th) | $74,500 | $35.82 |
| 75th percentile | $93,020 | $44.72 |
| 90th percentile | $96,830 | $46.55 |

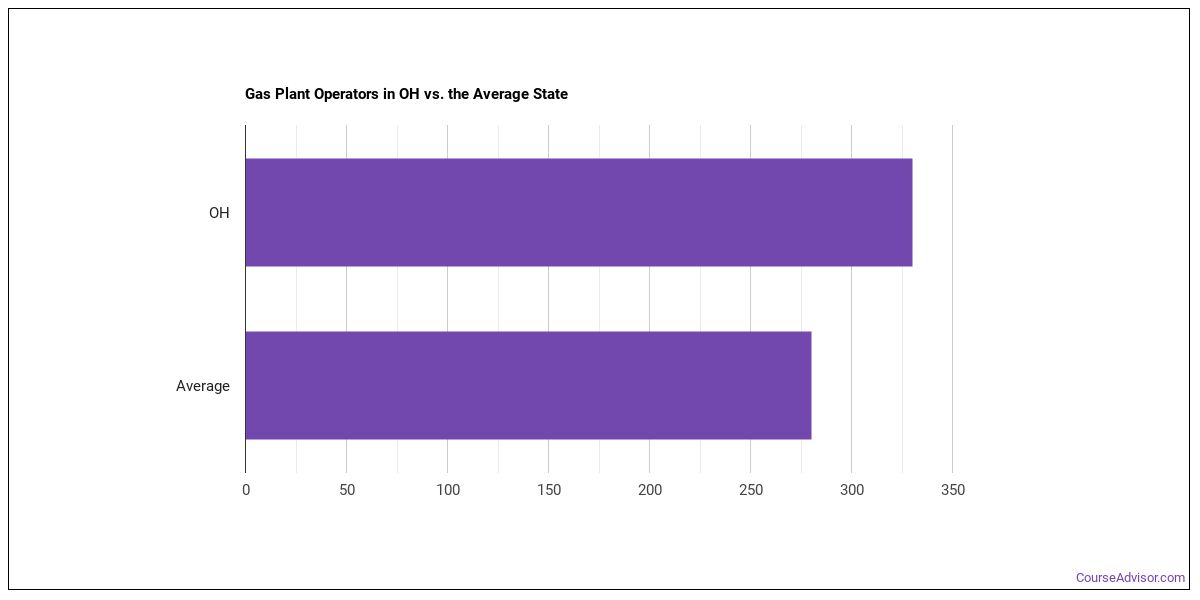
The job concentration index in Ohio relative to the national average — is 1.16, indicating that gas plant operators are more concentrated here than the national average.
National Wage Comparison
Nationally, gas plant operators earn a median of $57,281 per year ($27.54/hour), exceeding the Ohio median.
Employment Outlook
There are roughly 408,984 gas plant operators nationwide. In Ohio alone, around 660 people work in this role. That puts the state above the typical state, which employs around 260 gas plant operators.

Top Ohio Metros for Gas Plant Operators
These are the Ohio metros with the most gas plant operators in Ohio.
| Metro Area | Number Employed | Annual Median Salary |
|---|---|---|
| Cincinnati, OH-KY-IN | 80 | $63,430 |
| Cleveland, OH | 50 | $75,150 |
| Toledo, OH | 40 | $57,890 |
Top States for Gas Plant Operators Employment
View the states that employ the most gas plant operators work.
| State | Number Employed |
|---|---|
| Texas | 1,590 |
| Louisiana | 1,120 |
| Oklahoma | 980 |
| Illinois | 810 |
| Pennsylvania | 780 |
| Wyoming | 690 |
| Ohio | 660 |
| California | 630 |
| Michigan | 480 |
| Massachusetts | 480 |
| Colorado | 480 |
| Mississippi | 450 |
| West Virginia | 410 |
| Iowa | 400 |
| Kansas | 380 |
| Tennessee | 340 |
| Missouri | 310 |
| Kentucky | 290 |
| North Carolina | 270 |
| South Carolina | 270 |
Highest-Paying States for Gas Plant Operators
The highest-paying states for gas plant operators.
| State | Annual Median Salary |
|---|---|
| California | $124,980 |
| Connecticut | $107,400 |
| Oregon | $106,210 |
| Louisiana | $105,030 |
| New Jersey | $104,960 |
| Maryland | $104,340 |
| Massachusetts | $100,570 |
| Michigan | $98,320 |
| South Dakota | $98,170 |
| Illinois | $95,950 |
Skills
Top gas plant operators skills, rated on an importance scale of 0 to 5:
Knowledge Areas
Core knowledge areas for this occupation, rated on an importance scale of 0 to 5:
Abilities
The abilities that matter most for gas plant operators, rated on an importance scale of 0 to 5:
Daily Tasks
Day-to-day, gas plant operators typically:
- Monitor equipment functioning, observe temperature, level, and flow gauges, and perform regular unit checks to ensure that all equipment is operating as it should.
- Distribute or process gas for utility companies or industrial plants, using panel boards, control boards, and semi-automatic equipment.
- Control operation of compressors, scrubbers, evaporators, and refrigeration equipment to liquefy, compress, or regasify natural gas.
- Control equipment to regulate flow and pressure of gas to feedlines of boilers, furnaces, and related steam-generating or heating equipment.
- Record, review, and compile operations records, test results, and gauge readings such as temperatures, pressures, concentrations, and flows.
- Determine causes of abnormal pressure variances, and make corrective recommendations, such as installation of pipes to relieve overloading.
- Adjust temperature, pressure, vacuum, level, flow rate, or transfer of gas to maintain processes at required levels or to correct problems.
- Collaborate with other operators to solve unit problems.
- Monitor transportation and storage of flammable and other potentially dangerous products to ensure that safety guidelines are followed.
- Start and shut down plant equipment.
- Read logsheets to determine product demand and disposition, or to detect malfunctions.
- Contact maintenance crews when necessary.
Work Activities
- Identifying Objects, Actions, and Events
- Monitoring Processes, Materials, or Surroundings
- Making Decisions and Solving Problems
- Getting Information
- Evaluating Information to Determine Compliance with Standards
- Inspecting Equipment, Structures, or Materials
- Documenting/Recording Information
- Communicating with Supervisors, Peers, or Subordinates
- Controlling Machines and Processes
- Updating and Using Relevant Knowledge
- Processing Information
- Analyzing Data or Information
Tools & Technology
Common tools and software used in this occupation include: Hot technologies: Google Android In-demand technologies: Google Android
What Major Will Prepare You For This Career?
Programs that train for this career include:
- Mining & Petroleum Technology
Featured schools near , edit
Related Careers
Other careers like gas plant operators include:
- Geothermal Production Managers
- Biomass Power Plant Managers
- Service Unit Operators, Oil and Gas
- Control and Valve Installers and Repairers, Except Mechanical Door
- Wind Turbine Service Technicians
- Geothermal Technicians
Also Known As
Bulk Gas Specialist, Compressor Technician (Compressor Tech), Engine Room Operator, Field Gauger, Field Technician (Field Tech), Fuel Attendant, Gas Controller, Gas Dispatcher, Gas Distribution Plant Operator, Gas Maker, Gas Operator, Gas Plant Dispatcher, Gas Plant Operator, Gas Plant Specialist, Gas Plant Technician (Gas Plant Tech).
References
- U.S. Bureau of Labor Statistics, Occupational Employment and Wage Statistics — https://www.bls.gov/oes/
- O*NET Online — https://www.onetonline.org/
- BLS Employment Projections — https://www.bls.gov/emp/
- O*NET-SOC code: 51-8092.00
Course Advisor provides higher-education, college and university, degree, program, career, salary, and other helpful information to students, faculty, institutions, and other internet audiences. Presented information and data are subject to change. Inclusion on this website does not imply or represent a direct relationship with the company, school, or brand. Information, though believed correct at time of publication, may not be correct, and no warranty is provided. Contact the schools to verify any information before relying on it. Financial aid may be available for those who qualify. The displayed options may include sponsored or recommended results, not necessarily based on your preferences.
© Course Advisor – All Rights Reserved.