Gambling Managers in Nevada
Considering working as a Gambling Managers in Nevada? Here’s what the data says. Plan, direct, or coordinate gambling operations in a casino. May formulate house rules.
What do Gambling Managers Make in Nevada?
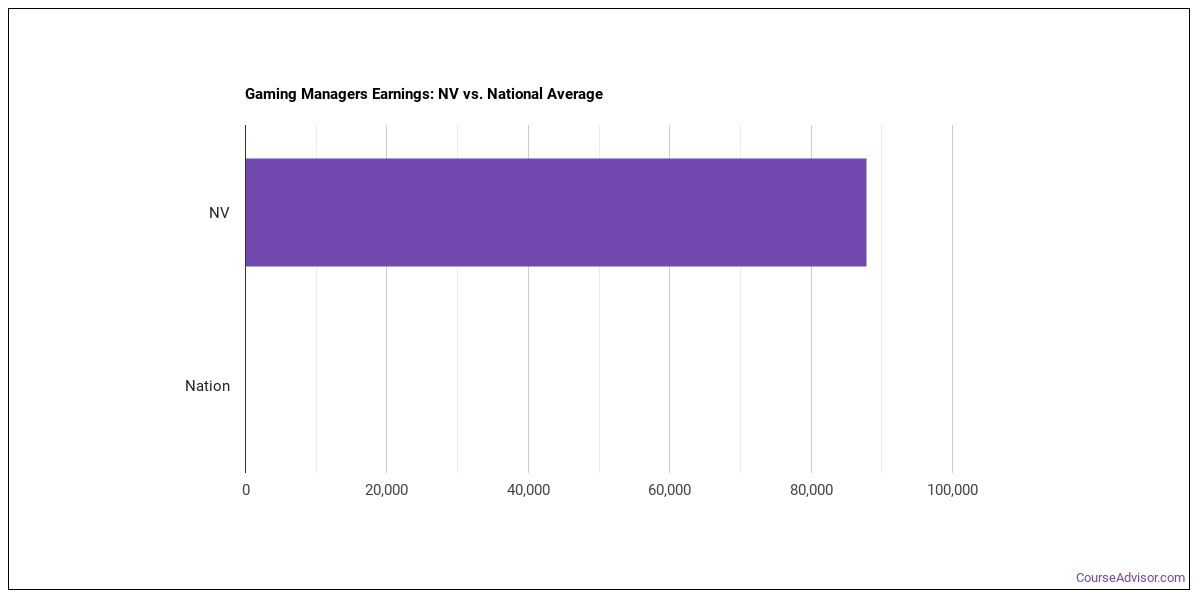
The gambling managers working in Nevada, wages run about $87,800 per year (or roughly $42.21/hour).Annual wages span from $46,320 at the 10th percentile to $176,860 at the 90th percentile.
| Wage Statistic | Annual | Hourly |
|---|---|---|
| 10th percentile | $46,320 | $22.27 |
| 25th percentile | $63,400 | $30.48 |
| Median (50th) | $87,800 | $42.21 |
| 75th percentile | $124,990 | $60.09 |
| 90th percentile | $176,860 | $85.03 |

Location quotient — how concentrated this career is in Nevada nationwide is 16.62, indicating that gambling managers are more concentrated here than the national average.
National Wage Comparison
Nationally, gambling managers earn a median of $140,375 per year ($67.49/hour), below the Nevada median.
Employment Outlook
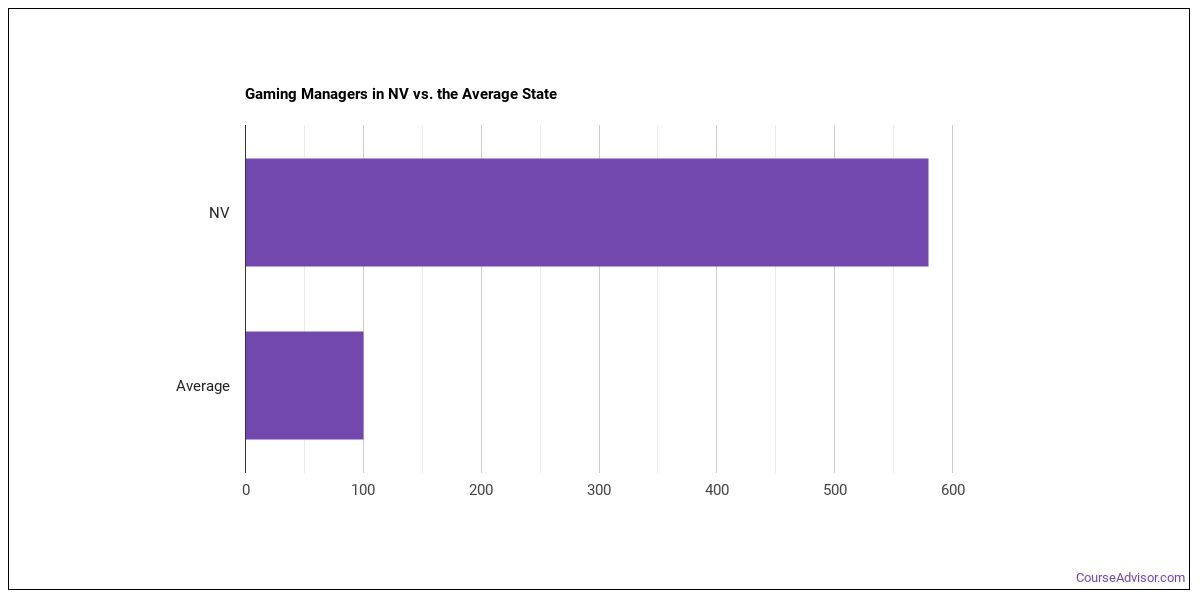
Nationally, total employment in this occupation is 330,043 gambling managers across the United States. In Nevada alone, approximately 760 people work in this role. That puts the state above the typical state, which employs around 120 gambling managers.

Top Nevada Metros for Gambling Managers
The largest metro-area employers of gambling managers in Nevada.
| Metro Area | Number Employed | Annual Median Salary |
|---|---|---|
| Las Vegas-Henderson-North Las Vegas, NV | 550 | $92,270 |
| Reno, NV | 110 | $72,570 |
Top States for Gambling Managers Employment
These states have the highest employment of gambling managers work.
| State | Number Employed |
|---|---|
| Nevada | 760 |
| California | 640 |
| Oklahoma | 260 |
| Illinois | 230 |
| Arizona | 200 |
| Louisiana | 180 |
| Mississippi | 170 |
| Pennsylvania | 160 |
| New Jersey | 150 |
| New York | 140 |
| Michigan | 130 |
| Maryland | 130 |
| Washington | 120 |
| Iowa | 110 |
| Ohio | 80 |
| Indiana | 70 |
| Puerto Rico | 70 |
| Missouri | 70 |
| New Mexico | 60 |
| Oregon | 40 |
Highest-Paying States for Gambling Managers
Where gambling managers earn the most: gambling managers.
| State | Annual Median Salary |
|---|---|
| Washington | $121,800 |
| Wisconsin | $107,700 |
| New Jersey | $106,140 |
| California | $102,810 |
| Maryland | $102,630 |
| Oregon | $101,780 |
| New Mexico | $99,810 |
| Michigan | $98,020 |
| Massachusetts | $97,720 |
| New York | $94,150 |
Skills
Key gambling managers skills, rated on an importance scale of 0 to 5:
Knowledge Areas
Core knowledge areas for this occupation, rated on an importance scale of 0 to 5:
Abilities
Key abilities for gambling managers, rated on an importance scale of 0 to 5:
Daily Tasks
Day-to-day, gambling managers typically:
- Resolve customer complaints regarding problems, such as payout errors.
- Remove suspected cheaters, such as card counters or other players who may have systems that shift the odds of winning to their favor.
- Track supplies of money to tables and perform any required paperwork.
- Explain and interpret house rules, such as game rules or betting limits.
- Prepare work schedules and station arrangements and keep attendance records.
- Monitor staffing levels to ensure that games and tables are adequately staffed for each shift, arranging for staff rotations and breaks and locating substitute employees as necessary.
- Maintain familiarity with all games used at a facility, as well as strategies or tricks employed in those games.
- Train new workers or evaluate their performance.
- Market or promote the casino to bring in business.
- Interview and hire workers.
- Direct the distribution of complimentary hotel rooms, meals, or other discounts or free items given to players, based on their length of play and betting totals.
- Establish policies on issues, such as the type of gambling offered and the odds, the extension of credit, or the serving of food and beverages.
Work Activities
- Communicating with Supervisors, Peers, or Subordinates
- Performing for or Working Directly with the Public
- Making Decisions and Solving Problems
- Getting Information
- Evaluating Information to Determine Compliance with Standards
- Resolving Conflicts and Negotiating with Others
- Working with Computers
- Documenting/Recording Information
- Establishing and Maintaining Interpersonal Relationships
- Coaching and Developing Others
- Staffing Organizational Units
- Analyzing Data or Information
Tools & Technology
Software and systems commonly involved: Hot technologies: Microsoft Excel In-demand technologies: Microsoft Excel
What Major Will Prepare You For This Career?
Programs that train for this career include:
- Hospitality Management
Featured schools near , edit
Related Careers
Other careers like gambling managers include:
- Financial Managers
- Food Service Managers
- Lodging Managers
- Athletes and Sports Competitors
- Umpires, Referees, and Other Sports Officials
- Gambling Surveillance Officers and Gambling Investigators
Also Known As
Baccarat Manager, Bingo Manager, Blackjack Manager, Cage Manager, Cage Shift Manager, Card Room Manager, Casino Manager, Casino Operations Manager, Casino Shift Manager, Craps Manager, Dice Manager, Gambling Director, Gambling Manager, Gaming Director, Gaming Manager.
References
- U.S. Bureau of Labor Statistics, Occupational Employment and Wage Statistics — https://www.bls.gov/oes/
- O*NET Online — https://www.onetonline.org/
- BLS Employment Projections — https://www.bls.gov/emp/
- O*NET-SOC code: 11-9071.00
Course Advisor provides higher-education, college and university, degree, program, career, salary, and other helpful information to students, faculty, institutions, and other internet audiences. Presented information and data are subject to change. Inclusion on this website does not imply or represent a direct relationship with the company, school, or brand. Information, though believed correct at time of publication, may not be correct, and no warranty is provided. Contact the schools to verify any information before relying on it. Financial aid may be available for those who qualify. The displayed options may include sponsored or recommended results, not necessarily based on your preferences.
© Course Advisor – All Rights Reserved.