Court, Municipal, and License Clerks in Michigan
Want to work as a Court, Municipal, and License Clerks in Michigan? Below are the key facts. Perform clerical duties for courts of law, municipalities, or governmental licensing agencies and bureaus. May prepare docket of cases to be called; secure information for judges and court; prepare draft agendas or bylaws for town or city council; answer official correspondence; keep fiscal records and accounts; issue licenses or permits; and record data, administer tests, or collect fees. Clerks of Court are classified in “Managers, All Other” (11-9199).
What do Court, Municipal, and License Clerks Make in Michigan?
For court, municipal, and license clerks working in Michigan, the typical annual salary is $47,240 per year (or roughly $22.71/hour).Pay can range from $31,200 at the 10th percentile to $63,550 at the 90th percentile.
| Wage Statistic | Annual | Hourly |
|---|---|---|
| 10th percentile | $31,200 | $15.00 |
| 25th percentile | $38,210 | $18.37 |
| Median (50th) | $47,240 | $22.71 |
| 75th percentile | $55,460 | $26.67 |
| 90th percentile | $63,550 | $30.56 |

The job concentration index in Michigan nationwide is 1.28, indicating that court, municipal, and license clerks are more concentrated here than the national average.
National Wage Comparison
Nationally, court, municipal, and license clerks earn a median of $39,473 per year ($18.98/hour), higher than the Michigan median.

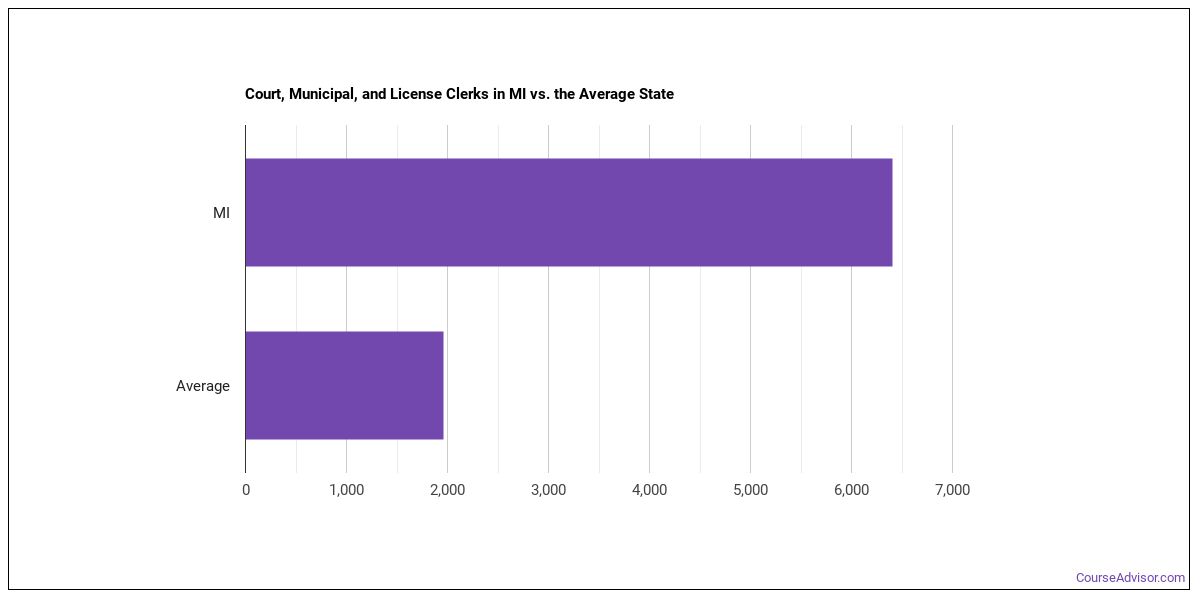
Employment Outlook
There are roughly 791,548 court, municipal, and license clerks in the U.S.. In Michigan alone, about 6,190 people work in this role. That’s more than the typical state, which employs around 2,200 court, municipal, and license clerks.

Top Michigan Metros for Court, Municipal, and License Clerks
The largest metro-area employers of court, municipal, and license clerks in Michigan.
| Metro Area | Number Employed | Annual Median Salary |
|---|---|---|
| Detroit-Warren-Dearborn, MI | 2,310 | $49,900 |
| Grand Rapids-Wyoming-Kentwood, MI | 630 | $46,230 |
| Lansing-East Lansing, MI | 260 | $46,960 |
| Ann Arbor, MI | 240 | $54,210 |
| Flint, MI | 220 | $49,460 |
| Traverse City, MI | 160 | $48,630 |
| Kalamazoo-Portage, MI | 130 | $50,690 |
| Monroe, MI | 80 | $49,730 |
| Niles, MI | 80 | $47,530 |
| Battle Creek, MI | 70 | $47,130 |
| Jackson, MI | 70 | $45,610 |
| Muskegon-Norton Shores, MI | 70 | $46,060 |
| Bay City, MI | 60 | $47,220 |
| Saginaw, MI | 50 | $43,380 |
| Midland, MI | 40 | $45,040 |
Top States for Court, Municipal, and License Clerks Employment
These states have the highest employment of court, municipal, and license clerks work.
| State | Number Employed |
|---|---|
| Texas | 14,030 |
| California | 13,630 |
| New York | 11,580 |
| Florida | 9,710 |
| Ohio | 9,590 |
| Colorado | 7,390 |
| Illinois | 6,570 |
| Michigan | 6,190 |
| Minnesota | 6,030 |
| New Jersey | 5,550 |
| North Carolina | 4,870 |
| Missouri | 4,650 |
| Georgia | 4,630 |
| Virginia | 4,440 |
| Arizona | 3,520 |
| Washington | 3,370 |
| Pennsylvania | 3,250 |
| Oklahoma | 3,070 |
| Tennessee | 2,780 |
| Mississippi | 2,760 |
Highest-Paying States for Court, Municipal, and License Clerks
Where court, municipal, and license clerks earn the most: court, municipal, and license clerks.
| State | Annual Median Salary |
|---|---|
| Washington | $62,460 |
| California | $62,390 |
| Connecticut | $60,610 |
| Massachusetts | $59,950 |
| Oregon | $58,790 |
| Rhode Island | $58,560 |
| Maryland | $56,440 |
| Alaska | $55,930 |
| Nevada | $55,390 |
| Minnesota | $55,310 |
Skills
The most important court, municipal, and license clerks skills, rated on an importance scale of 0 to 5:
Knowledge Areas
Core knowledge areas for this occupation, rated on an importance scale of 0 to 5:
Abilities
The abilities that matter most for court, municipal, and license clerks, rated on an importance scale of 0 to 5:
Daily Tasks
Common tasks include:
- Evaluate information on applications to verify completeness and accuracy and to determine whether applicants are qualified to obtain desired licenses.
- Perform administrative tasks, such as answering telephone calls, filing court documents, or maintaining office supplies or equipment.
- Verify the authenticity of documents, such as foreign identification or immigration documents.
- Record and edit the minutes of meetings and distribute to appropriate officials or staff members.
- Question applicants to obtain required information, such as name, address, or age, and record data on prescribed forms.
- Issue public notification of all official activities or meetings.
- Record and maintain all vital and fiscal records and accounts.
- Record case dispositions, court orders, or arrangements made for payment of court fees.
- Answer questions or provide advice to the public regarding licensing policies, procedures, or regulations.
- Prepare meeting agendas or packets of related information.
- Examine legal documents submitted to courts for adherence to laws or court procedures.
- Prepare ordinances, resolutions, or proclamations so that they can be executed, recorded, archived, or distributed.
Work Activities
- Working with Computers
- Getting Information
- Performing for or Working Directly with the Public
- Communicating with Supervisors, Peers, or Subordinates
- Processing Information
- Documenting/Recording Information
- Updating and Using Relevant Knowledge
- Establishing and Maintaining Interpersonal Relationships
- Communicating with People Outside the Organization
- Performing Administrative Activities
- Organizing, Planning, and Prioritizing Work
- Evaluating Information to Determine Compliance with Standards
Tools & Technology
Common tools and software used in this occupation include: Hot technologies: Adobe Acrobat In-demand technologies: Microsoft Excel
Related Careers
Careers similar to court, municipal, and license clerks include:
- Compliance Officers
- Tax Examiners and Collectors, and Revenue Agents
- Lawyers
- Judicial Law Clerks
- Administrative Law Judges, Adjudicators, and Hearing Officers
- Judges, Magistrate Judges, and Magistrates
Also Known As
Agent Licensing Clerk, Animal Control Licensing Worker, Appeals Clerk, Appellate Court Clerk, Basic Traffic Minute Clerk, Birth Certification Clerk, Calendar Clerk, Case Clerk, Circuit Clerk, Circuit Court Clerk, City Clerk, City Recorder, City Secretary, Civil Clerk, County Clerk.
References
- U.S. Bureau of Labor Statistics, Occupational Employment and Wage Statistics — https://www.bls.gov/oes/
- O*NET Online — https://www.onetonline.org/
- BLS Employment Projections — https://www.bls.gov/emp/
- O*NET-SOC code: 43-4031.00
Course Advisor provides higher-education, college and university, degree, program, career, salary, and other helpful information to students, faculty, institutions, and other internet audiences. Presented information and data are subject to change. Inclusion on this website does not imply or represent a direct relationship with the company, school, or brand. Information, though believed correct at time of publication, may not be correct, and no warranty is provided. Contact the schools to verify any information before relying on it. Financial aid may be available for those who qualify. The displayed options may include sponsored or recommended results, not necessarily based on your preferences.
© Course Advisor – All Rights Reserved.