Chief Executives in New York
Want to work as a Chief Executives in New York? Here’s what the data says. Determine and formulate policies and provide overall direction of companies or private and public sector organizations within guidelines set up by a board of directors or similar governing body. Plan, direct, or coordinate operational activities at the highest level of management with the help of subordinate executives and staff managers.
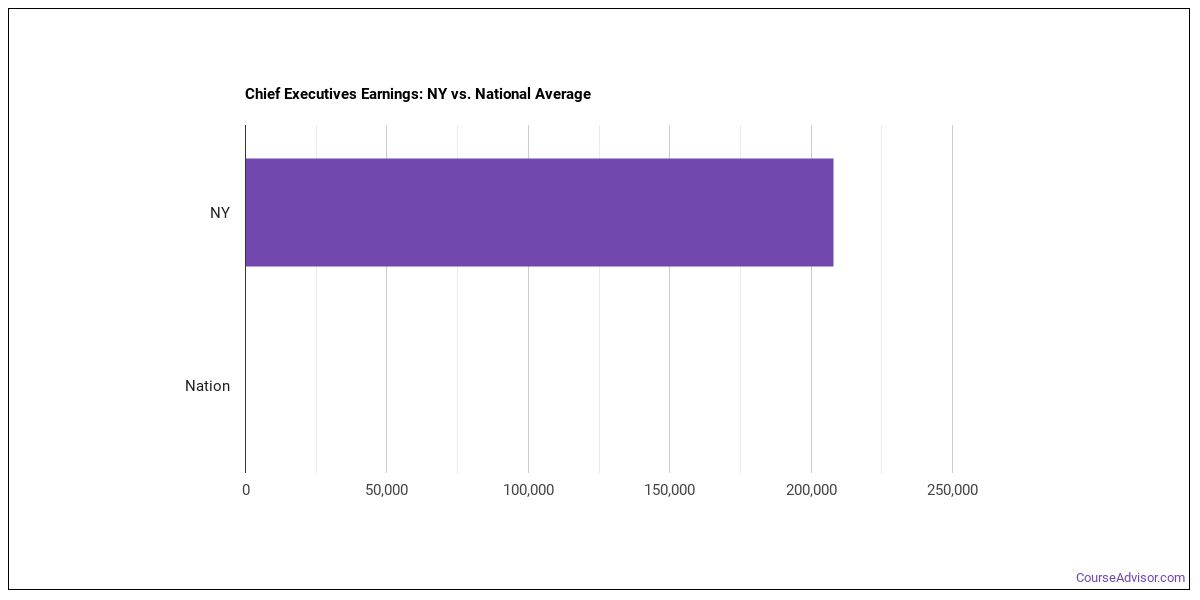
What do Chief Executives Make in New York?
For a chief executives working in New York, wages run about $219,320 per year (or about $105.44/hour).
| Wage Statistic | Annual | Hourly |
|---|---|---|
| 10th percentile | $126,380 | $60.76 |
| 25th percentile | $169,990 | $81.73 |
| Median (50th) | $219,320 | $105.44 |
| 75th percentile | n/a | n/a |
| 90th percentile | n/a | n/a |

The job concentration index in New York nationwide is 0.60, meaning fewer chief executives per worker than the national average.
National Wage Comparison
Nationally, chief executives earn a median of $138,534 per year ($66.60/hour), exceeding the New York median.
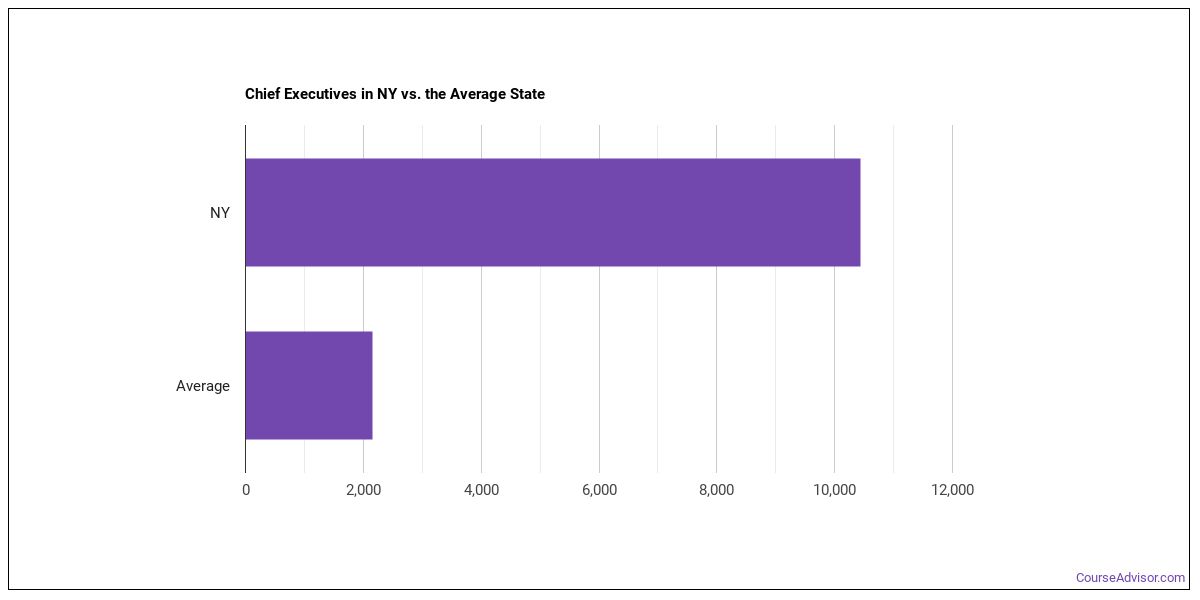
Employment Outlook
Nationally, total employment in this occupation is 385,243 chief executives nationwide. In New York alone, around 7,830 people work in this role. That puts the state above the typical state, which employs around 2,340 chief executives.

Top New York Metros for Chief Executives
These are the New York metros with the most chief executives in New York.
| Metro Area | Number Employed | Annual Median Salary |
|---|---|---|
| Albany-Schenectady-Troy, NY | 620 | $172,840 |
| Buffalo-Cheektowaga, NY | 360 | $204,360 |
| Rochester, NY | 280 | $185,280 |
| Syracuse, NY | 160 | n/a |
| Kiryas Joel-Poughkeepsie-Newburgh, NY | 140 | $184,950 |
| Utica-Rome, NY | 90 | $165,280 |
| Binghamton, NY | 60 | $151,370 |
| Ithaca, NY | 40 | n/a |
| Kingston, NY | 40 | $182,150 |
| Glens Falls, NY | 30 | $161,140 |
Top States for Chief Executives Employment
These states have the highest employment of chief executives work.
| State | Number Employed |
|---|---|
| California | 36,980 |
| Pennsylvania | 14,140 |
| New York | 7,830 |
| Massachusetts | 7,110 |
| Minnesota | 6,690 |
| Georgia | 5,440 |
| Tennessee | 5,360 |
| Illinois | 5,150 |
| Virginia | 4,620 |
| Maryland | 4,580 |
| Wisconsin | 4,440 |
| Ohio | 4,430 |
| Washington | 4,140 |
| Missouri | 4,050 |
| Utah | 3,980 |
| Michigan | 3,940 |
| Iowa | 3,520 |
| Arizona | 3,100 |
| Kentucky | 2,950 |
| South Carolina | 2,950 |
Highest-Paying States for Chief Executives
The highest-paying states for chief executives.
| State | Annual Median Salary |
|---|---|
| Hawaii | $231,500 |
| California | $220,600 |
| Pennsylvania | $220,510 |
| New York | $219,320 |
| Michigan | $219,230 |
| Rhode Island | $211,810 |
| Wisconsin | $209,090 |
| Ohio | $208,590 |
| Nebraska | $206,080 |
| Indiana | $205,780 |
Skills
Key chief executives skills, rated on an importance scale of 0 to 5:
Knowledge Areas
Core knowledge areas for this occupation, rated on an importance scale of 0 to 5:
Abilities
Key abilities for chief executives, rated on an importance scale of 0 to 5:
Daily Tasks
Chief Executives typically:
- Direct or coordinate an organization's financial or budget activities to fund operations, maximize investments, or increase efficiency.
- Confer with board members, organization officials, or staff members to discuss issues, coordinate activities, or resolve problems.
- Prepare budgets for approval, including those for funding or implementation of programs.
- Direct, plan, or implement policies, objectives, or activities of organizations or businesses to ensure continuing operations, to maximize returns on investments, or to increase productivity.
- Prepare or present reports concerning activities, expenses, budgets, government statutes or rulings, or other items affecting businesses or program services.
- Implement corrective action plans to solve organizational or departmental problems.
- Analyze operations to evaluate performance of a company or its staff in meeting objectives or to determine areas of potential cost reduction, program improvement, or policy change.
- Direct or coordinate activities of businesses or departments concerned with production, pricing, sales, or distribution of products.
- Direct human resources activities, including the approval of human resource plans or activities, the selection of directors or other high-level staff, or establishment or organization of major departments.
- Appoint department heads or managers and assign or delegate responsibilities to them.
- Interpret and explain policies, rules, regulations, or laws to organizations, government or corporate officials, or individuals.
- Review reports submitted by staff members to recommend approval or to suggest changes.
Work Activities
- Making Decisions and Solving Problems
- Establishing and Maintaining Interpersonal Relationships
- Communicating with Supervisors, Peers, or Subordinates
- Guiding, Directing, and Motivating Subordinates
- Coaching and Developing Others
- Developing and Building Teams
- Developing Objectives and Strategies
- Getting Information
- Communicating with People Outside the Organization
- Organizing, Planning, and Prioritizing Work
- Evaluating Information to Determine Compliance with Standards
- Resolving Conflicts and Negotiating with Others
Tools & Technology
Software and systems commonly involved: Hot technologies: Adobe Acrobat, Atlassian JIRA In-demand technologies: Microsoft Excel
What Major Will Prepare You For This Career?
Related college programs include:
- Business Administration & Management
- Business & Commerce
- Finance & Financial Management
- Management Sciences & Methods
- Entrepreneurial Studies
- International Business
- Public Administration
Featured schools near , edit
Related Careers
Related occupations to chief executives include:
- Financial Managers
- Treasurers and Controllers
- Human Resources Managers
- Education Administrators, Postsecondary
- Social and Community Service Managers
- Compliance Managers
Also Known As
Aeronautics Commission Director, Agency Owner, Agricultural Services Director, Arts and Humanities Council Director, Bank President, Bureau Chief, Business Development Executive (BD Executive), Business Development Officer (BD Officer), Business Enterprise Officer, Business Executive, CEO (Chief Executive Officer), Chief Administrative Officer (CAO), Chief Diversity Officer (CDO), Chief Financial Officer (CFO), Chief Information Officer (CIO).
References
- U.S. Bureau of Labor Statistics, Occupational Employment and Wage Statistics — https://www.bls.gov/oes/
- O*NET Online — https://www.onetonline.org/
- BLS Employment Projections — https://www.bls.gov/emp/
- O*NET-SOC code: 11-1011.00
Course Advisor provides higher-education, college and university, degree, program, career, salary, and other helpful information to students, faculty, institutions, and other internet audiences. Presented information and data are subject to change. Inclusion on this website does not imply or represent a direct relationship with the company, school, or brand. Information, though believed correct at time of publication, may not be correct, and no warranty is provided. Contact the schools to verify any information before relying on it. Financial aid may be available for those who qualify. The displayed options may include sponsored or recommended results, not necessarily based on your preferences.
© Course Advisor – All Rights Reserved.