Chief Executives in California
Is California a good place for you to work as a Chief Executive?
While jobs for Chief Executives in California are decreasing, those who do work in these jobs get paid higher than average.
-
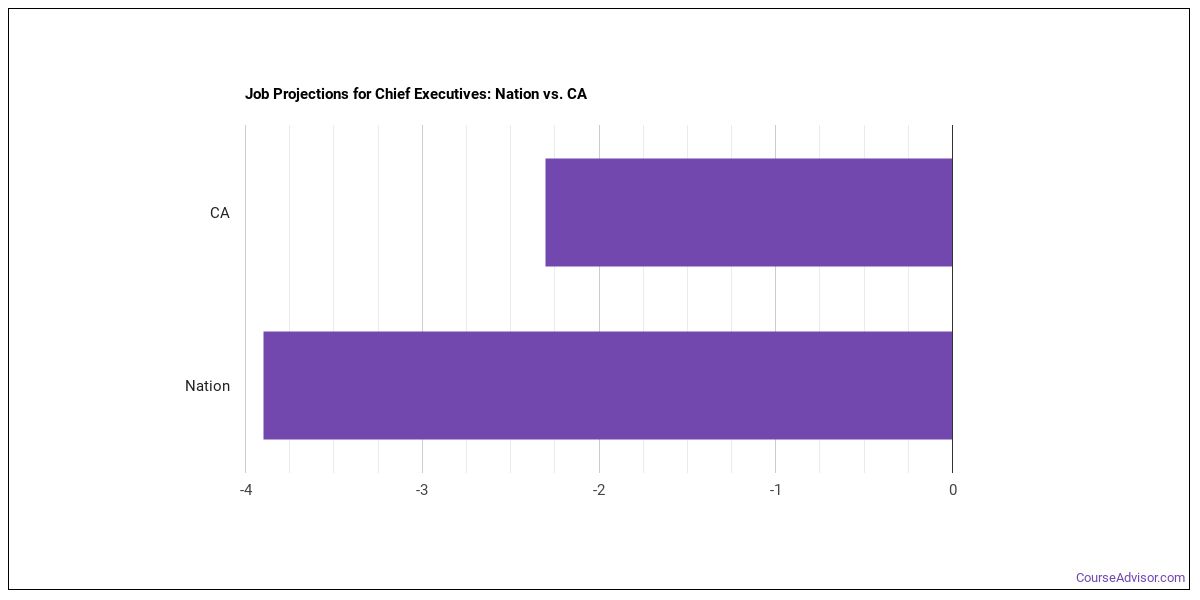
Employment for Chief Executives in California is expected to decrease.
-
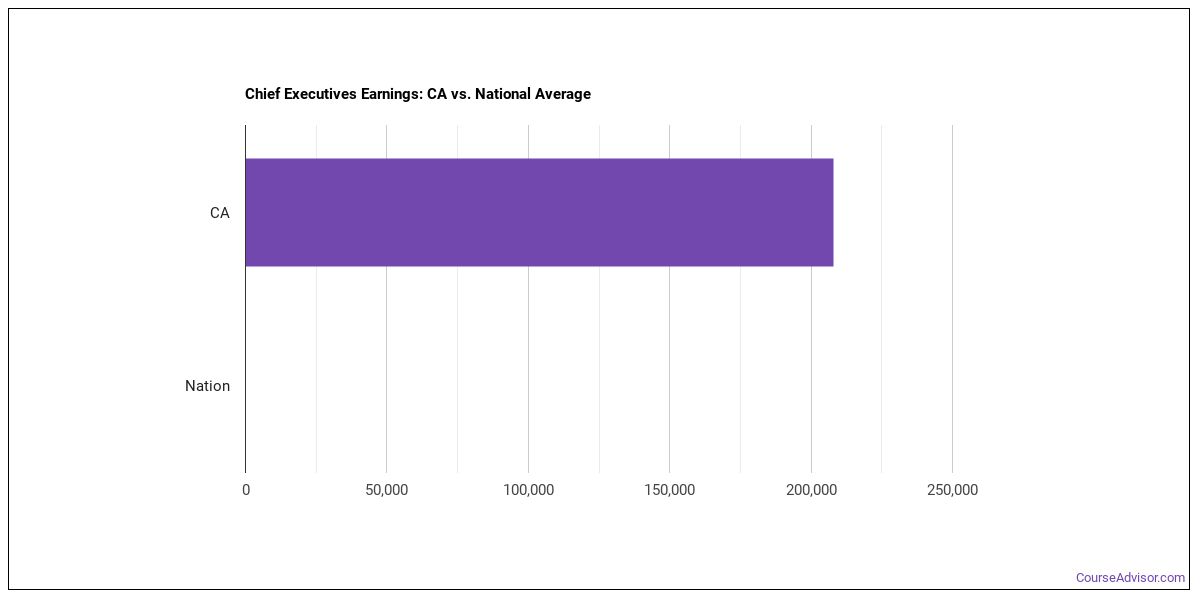
Chief Executives in California earn higher salaries than the typical U.S. wage earner.
Featured schools near , edit
How Many Chief Executives Work in California?
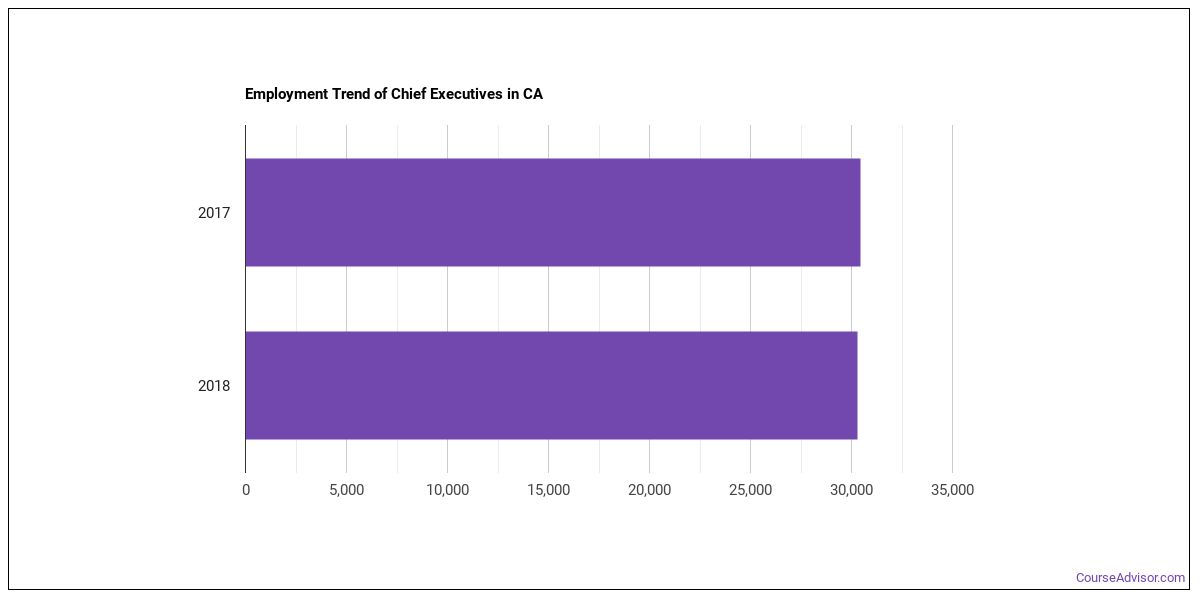
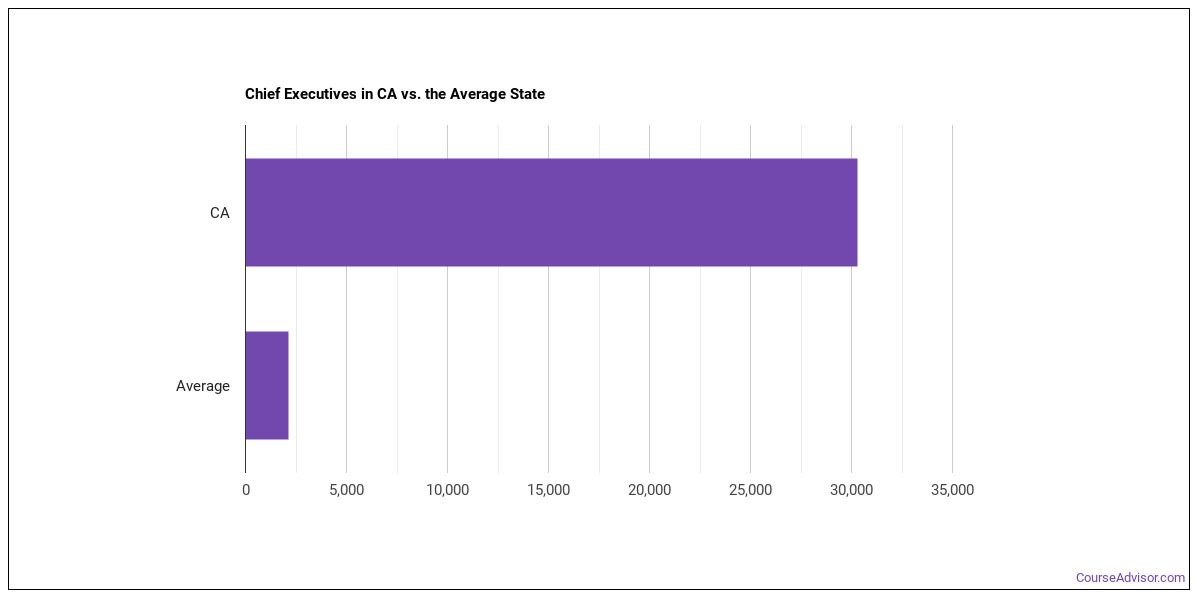
In California, there were 30,290 people working as Chief Executives in the year 2018.
There were 30,430 Chief Executives employed in this state in 2017.
That’s a decline of 140 jobs between 2017 and 2018.
The typical state has 2,150 Chief Executives working in it, which means California has more Chief Executives than average.
Job Projections for California
Jobs for Chief Executives in this state are declining at a rate of 2.3% which is a slower decline than the nationwide estimated projection of
California Annual Job Openings
The BLS is projecting 2,840 annual Chief Executives job openings in California, and 41,600 total jobs in the year 2026.
Nationwide, the prediction is 20,000 annual jobs and 296,800 total jobs in 2026.
What do Chief Executives Make in California?
In 2018 wages for Chief Executives ranged from $105,340 to $208,000 with $208,000 being the median annual salary.
Broken down to an hourly rate, workers in this field made anywhere from $50.64 to $100. The median hourly rate was $100.
Workers in this field were paid a median of $100 an hour in 2017.
Wages between 2017 and 2018 did not increase or decrease.
The median salary in California is higher than the nationwide median salary.
Top California Metros for Chief Executives
The table below shows some of the metros in this state with the most Chief Executives.
| Metro | Number Employed | Annual Median Salary |
|---|---|---|
| Los Angeles-Long Beach-Anaheim, CA | 10,440 | $208,000 |
| San Francisco-Oakland-Hayward, CA | 5,040 | $208,000 |
| Sacramento–Roseville–Arden-Arcade, CA | 2,820 | $145,490 |
| San Diego-Carlsbad, CA | 2,720 | $208,000 |
| Riverside-San Bernardino-Ontario, CA | 1,620 | $189,820 |
| Fresno, CA | 430 | $169,170 |
| Oxnard-Thousand Oaks-Ventura, CA | 430 | $208,000 |
| Santa Rosa, CA | 360 | $197,240 |
| Bakersfield, CA | 320 | $203,640 |
| Santa Maria-Santa Barbara, CA | 300 | $159,840 |
| Stockton-Lodi, CA | 280 | $207,800 |
| Salinas, CA | 260 | $194,980 |
| San Luis Obispo-Paso Robles-Arroyo Grande, CA | 200 | $153,320 |
| Modesto, CA | 200 | $180,210 |
| Santa Cruz-Watsonville, CA | 190 | $169,740 |
| Vallejo-Fairfield, CA | 160 | $197,730 |
| Visalia-Porterville, CA | 150 | $194,140 |
| Napa, CA | 140 | $208,000 |
| Redding, CA | 110 | $105,740 |
| Merced, CA | 70 | $208,000 |
| Chico, CA | 70 | $158,210 |
| Yuba City, CA | 60 | $185,670 |
| El Centro, CA | 50 | $208,000 |
| Madera, CA | 40 | $148,810 |
| Hanford-Corcoran, CA | 30 | $184,910 |
Top States for Chief Executives Employment
The table below shows the states where most Chief Executives work.
| State | Number Employed | Annual Median Salary |
|---|---|---|
| California | 30,290 | $208,000 |
| Florida | 20,860 | $171,000 |
| New York | 10,430 | $208,000 |
| Illinois | 9,650 | $208,000 |
| Massachusetts | 7,990 | $208,000 |
| Tennessee | 6,680 | $129,720 |
| Arizona | 6,630 | $179,410 |
| Pennsylvania | 6,540 | $208,000 |
| Georgia | 6,260 | $208,000 |
| Minnesota | 5,970 | $176,550 |
| Virginia | 5,760 | $208,000 |
| Texas | 5,260 | $208,000 |
| Wisconsin | 5,240 | $127,330 |
| Utah | 4,850 | $151,750 |
| Ohio | 4,420 | $196,500 |
| Missouri | 4,410 | $144,070 |
| Indiana | 4,220 | $124,090 |
| North Carolina | 3,820 | $205,220 |
| Kansas | 3,790 | $149,880 |
| Washington | 3,690 | $206,560 |
Below are the states where Chief Executives get paid the most:
| State | Annual Median Salary |
|---|---|
| New York | $208,000 |
| Oregon | $208,000 |
| New Jersey | $208,000 |
| Texas | $208,000 |
| California | $208,000 |
| Nevada | $208,000 |
| Illinois | $208,000 |
| District of Columbia | $208,000 |
| Nebraska | $208,000 |
| Georgia | $208,000 |
References
- Bureau of Labor Statistics (BLS)
- College Factual
- National Center for Education Statistics
- O*NET Online
More about our data sources and methodologies.
Featured Schools
 Request Info
|
Southern New Hampshire University You have goals. Southern New Hampshire University can help you get there. Whether you need a bachelor's degree to get into a career or want a master's degree to move up in your current career, SNHU has an online program for you. Find your degree from over 200 online programs. Learn More > |
Course Advisor provides higher-education, college and university, degree, program, career, salary, and other helpful information to students, faculty, institutions, and other internet audiences. Presented information and data are subject to change. Inclusion on this website does not imply or represent a direct relationship with the company, school, or brand. Information, though believed correct at time of publication, may not be correct, and no warranty is provided. Contact the schools to verify any information before relying on it. Financial aid may be available for those who qualify. The displayed options may include sponsored or recommended results, not necessarily based on your preferences.
© Course Advisor – All Rights Reserved.