Chemical Technicians in California
Considering working as a Chemical Technicians in California? Here’s what the data says. Conduct chemical and physical laboratory tests to assist scientists in making qualitative and quantitative analyses of solids, liquids, and gaseous materials for research and development of new products or processes, quality control, maintenance of environmental standards, and other work involving experimental, theoretical, or practical application of chemistry and related sciences.
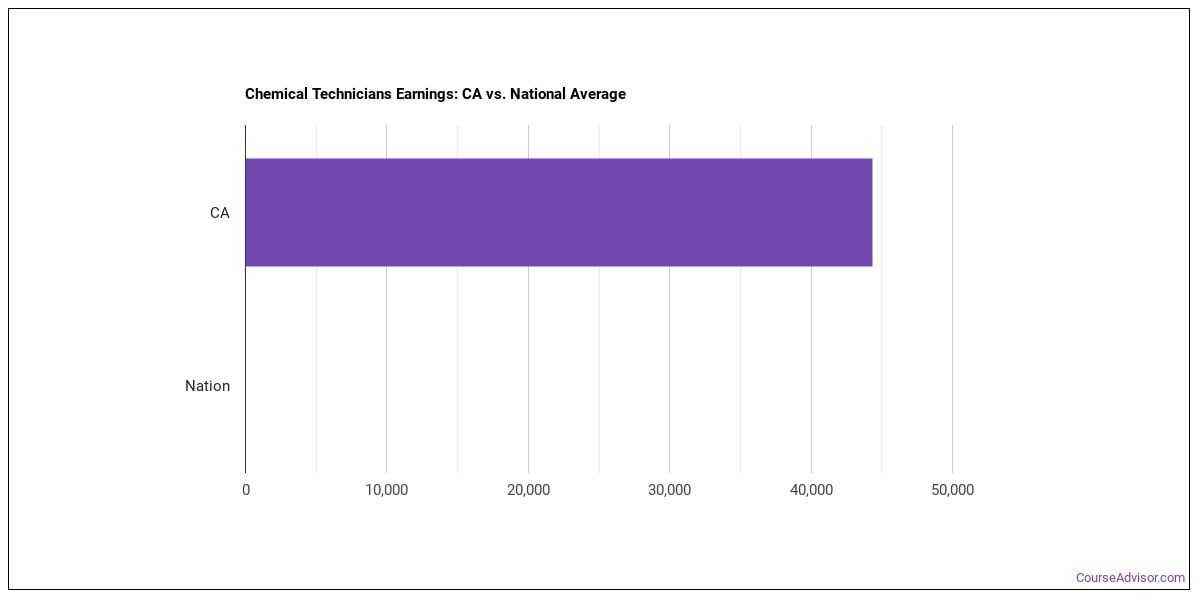
What do Chemical Technicians Make in California?
For a chemical technicians working in California, the median annual wage is $56,620 per year (or roughly $27.22/hour).Annual wages span from $40,350 at the 10th percentile to $88,990 at the 90th percentile.
| Wage Statistic | Annual | Hourly |
|---|---|---|
| 10th percentile | $40,350 | $19.40 |
| 25th percentile | $47,440 | $22.81 |
| Median (50th) | $56,620 | $27.22 |
| 75th percentile | $70,410 | $33.85 |
| 90th percentile | $88,990 | $42.78 |

The location quotient — a measure of how concentrated this occupation is in California compared to the national average — is 0.99.
National Wage Comparison
Nationally, chemical technicians earn a median of $60,181 per year ($28.93/hour), lower than the California median.
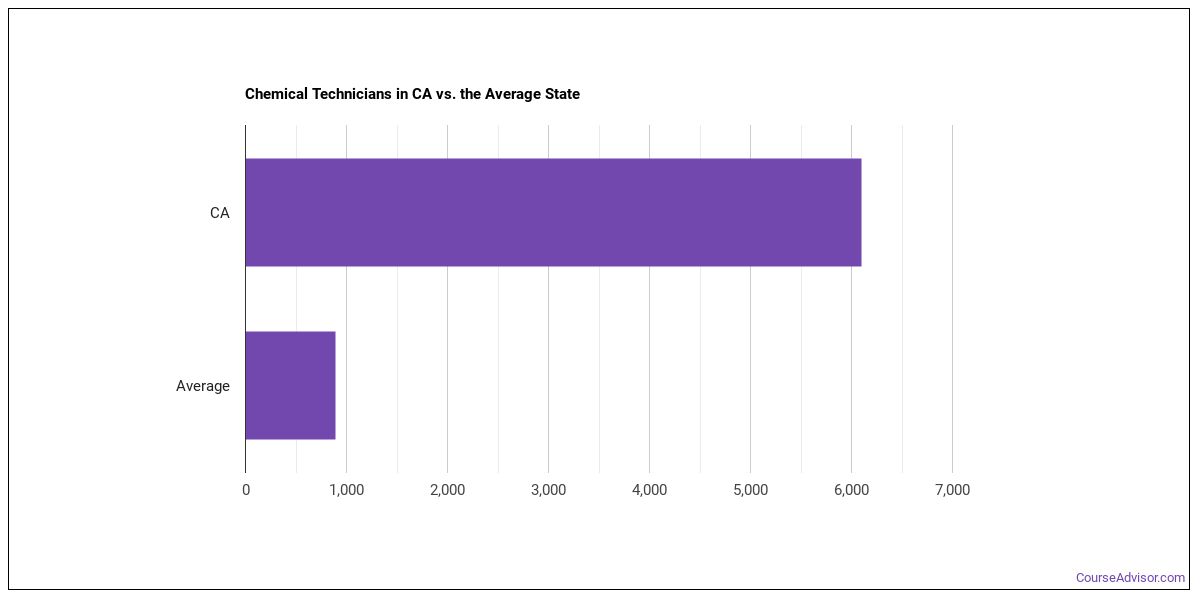
Employment Outlook
Nationally, total employment in this occupation is 121,867 chemical technicians in the U.S.. In California alone, around 6,480 people work in this role. That’s more than the typical state, which employs around 760 chemical technicians.

Top California Metros for Chemical Technicians
The largest metro-area employers of chemical technicians in California.
| Metro Area | Number Employed | Annual Median Salary |
|---|---|---|
| Los Angeles-Long Beach-Anaheim, CA | 2,020 | $51,140 |
| San Francisco-Oakland-Fremont, CA | 1,210 | $68,000 |
| San Diego-Chula Vista-Carlsbad, CA | 810 | $53,090 |
| San Jose-Sunnyvale-Santa Clara, CA | 460 | $61,670 |
| Riverside-San Bernardino-Ontario, CA | 380 | $49,220 |
| Sacramento-Roseville-Folsom, CA | 230 | $58,690 |
| Modesto, CA | 150 | $55,310 |
| Bakersfield-Delano, CA | 140 | $50,950 |
| Fresno, CA | 130 | $45,990 |
| Oxnard-Thousand Oaks-Ventura, CA | 120 | $47,290 |
| Santa Rosa-Petaluma, CA | 110 | $53,420 |
| Napa, CA | 90 | $53,710 |
| Stockton-Lodi, CA | 80 | $48,020 |
| Vallejo, CA | 80 | $58,320 |
| Santa Maria-Santa Barbara, CA | 70 | $56,160 |
| Visalia, CA | 60 | $47,870 |
| San Luis Obispo-Paso Robles, CA | 40 | $50,800 |
Top States for Chemical Technicians Employment
View the states that employ the most chemical technicians work.
| State | Number Employed |
|---|---|
| Texas | 6,510 |
| California | 6,480 |
| New Jersey | 3,210 |
| Pennsylvania | 3,050 |
| Ohio | 2,500 |
| New York | 2,350 |
| Michigan | 2,300 |
| Massachusetts | 2,200 |
| Florida | 1,960 |
| Tennessee | 1,740 |
| Illinois | 1,410 |
| Indiana | 1,410 |
| North Carolina | 1,360 |
| South Carolina | 1,300 |
| Alabama | 1,180 |
| Colorado | 1,140 |
| Puerto Rico | 1,070 |
| Virginia | 1,070 |
| Wisconsin | 970 |
| Louisiana | 950 |
Highest-Paying States for Chemical Technicians
These states pay the most for chemical technicians.
| State | Annual Median Salary |
|---|---|
| Louisiana | $83,480 |
| Delaware | $64,930 |
| Massachusetts | $64,920 |
| Colorado | $64,540 |
| Texas | $64,520 |
| Oklahoma | $63,880 |
| West Virginia | $63,820 |
| Arizona | $63,030 |
| New Mexico | $62,610 |
| Illinois | $61,830 |
Skills
The most important chemical technicians skills, rated on an importance scale of 0 to 5:
Knowledge Areas
Key knowledge areas for this occupation, rated on an importance scale of 0 to 5:
Abilities
The abilities that matter most for chemical technicians, rated on an importance scale of 0 to 5:
Daily Tasks
Chemical Technicians typically:
- Conduct chemical or physical laboratory tests to assist scientists in making qualitative or quantitative analyses of solids, liquids, or gaseous materials.
- Maintain, clean, or sterilize laboratory instruments or equipment.
- Monitor product quality to ensure compliance with standards and specifications.
- Set up and conduct chemical experiments, tests, and analyses, using techniques such as chromatography, spectroscopy, physical or chemical separation techniques, or microscopy.
- Prepare chemical solutions for products or processes, following standardized formulas, or create experimental formulas.
- Compile and interpret results of tests and analyses.
- Provide and maintain a safe work environment by participating in safety programs, committees, or teams and by conducting laboratory or plant safety audits.
- Provide technical support or assistance to chemists or engineers.
- Develop or conduct programs of sampling and analysis to maintain quality standards of raw materials, chemical intermediates, or products.
- Train new employees on topics such as the proper operation of laboratory equipment.
- Write technical reports or prepare graphs or charts to document experimental results.
- Order and inventory materials to maintain supplies.
Work Activities
- Documenting/Recording Information
- Processing Information
- Monitoring Processes, Materials, or Surroundings
- Making Decisions and Solving Problems
- Inspecting Equipment, Structures, or Materials
- Organizing, Planning, and Prioritizing Work
- Communicating with Supervisors, Peers, or Subordinates
- Working with Computers
- Evaluating Information to Determine Compliance with Standards
- Getting Information
- Analyzing Data or Information
- Identifying Objects, Actions, and Events
Tools & Technology
Software and systems commonly involved: Hot technologies: C++, Linux In-demand technologies: Microsoft Excel
What Major Will Prepare You For This Career?
Programs that train for this career include:
- Chemistry
- Physical Science Technicians
Featured schools near , edit
Related Careers
Careers similar to chemical technicians include:
- Chemical Engineers
- Industrial Engineers
- Materials Engineers
- Aerospace Engineering and Operations Technologists and Technicians
- Industrial Engineering Technologists and Technicians
- Nanotechnology Engineering Technologists and Technicians
Also Known As
Analysis Tester, Analytical Laboratory Technician (Analytical Lab Technician), Analytical Technician, Assayer, Bleach Analyst, Chemical Analyst, Chemical Analytical Sampler, Chemical Dependency Technician (Chemical Dependency Tech), Chemical Engineering Technician, Chemical Laboratory Assistant (Chemical Lab Assistant), Chemical Laboratory Technician (Chemical Lab Technician), Chemical Laboratory Tester (Chemical Lab Tester), Chemical Process Technician (Chemical Process Tech), Chemical Research Worker, Chemical Technician.
References
- U.S. Bureau of Labor Statistics, Occupational Employment and Wage Statistics — https://www.bls.gov/oes/
- O*NET Online — https://www.onetonline.org/
- BLS Employment Projections — https://www.bls.gov/emp/
- O*NET-SOC code: 19-4031.00
Course Advisor provides higher-education, college and university, degree, program, career, salary, and other helpful information to students, faculty, institutions, and other internet audiences. Presented information and data are subject to change. Inclusion on this website does not imply or represent a direct relationship with the company, school, or brand. Information, though believed correct at time of publication, may not be correct, and no warranty is provided. Contact the schools to verify any information before relying on it. Financial aid may be available for those who qualify. The displayed options may include sponsored or recommended results, not necessarily based on your preferences.
© Course Advisor – All Rights Reserved.