Chemical Plant and System Operators in North Carolina
Want to work as a Chemical Plant and System Operators in North Carolina? Here’s what you need to know. Control or operate entire chemical processes or system of machines.
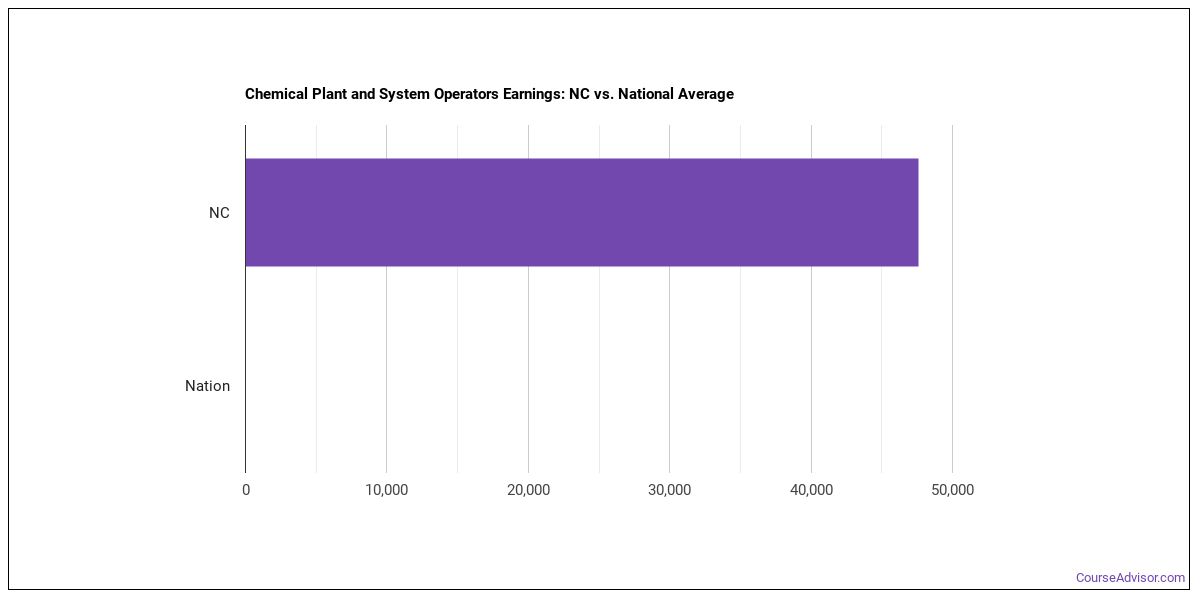
What do Chemical Plant and System Operators Make in North Carolina?
For chemical plant and system operators working in North Carolina, the median annual wage is $56,630 per year (or about $27.22/hour).Pay can range from $46,300 at the 10th percentile to $69,020 at the 90th percentile.
| Wage Statistic | Annual | Hourly |
|---|---|---|
| 10th percentile | $46,300 | $22.26 |
| 25th percentile | $50,090 | $24.08 |
| Median (50th) | $56,630 | $27.22 |
| 75th percentile | $62,940 | $30.26 |
| 90th percentile | $69,020 | $33.18 |

The job concentration index in North Carolina nationwide is 2.00, meaning that chemical plant and system operators are more concentrated here than the national average.
National Wage Comparison
Nationally, chemical plant and system operators earn a median of $27,362 per year ($13.15/hour), above the North Carolina median.
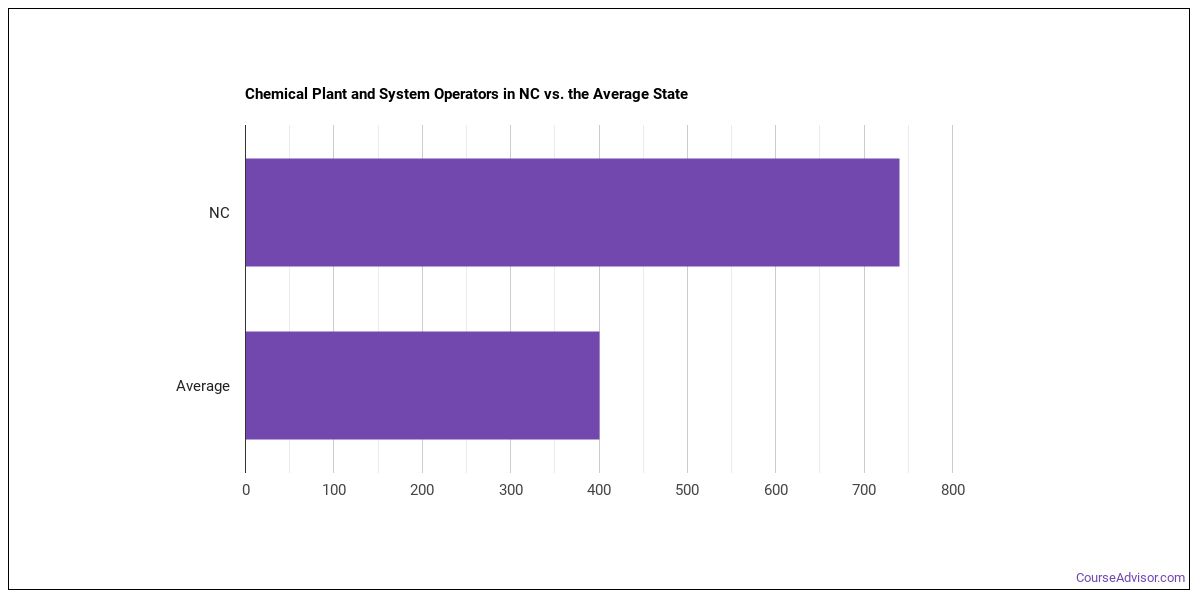
Employment Outlook
Nationally, total employment in this occupation is 180,891 chemical plant and system operators in the U.S.. In North Carolina alone, approximately 1,130 people work in this role. That puts the state above the typical state, which employs around 290 chemical plant and system operators.

Top North Carolina Metros for Chemical Plant and System Operators
The metro areas below employ the most chemical plant and system operators in North Carolina.
| Metro Area | Number Employed | Annual Median Salary |
|---|---|---|
| Greensboro-High Point, NC | 110 | $61,520 |
Top States for Chemical Plant and System Operators Employment
View the states that employ the most chemical plant and system operators work.
| State | Number Employed |
|---|---|
| Louisiana | 3,360 |
| Texas | 2,980 |
| North Carolina | 1,130 |
| Pennsylvania | 750 |
| California | 590 |
| South Carolina | 480 |
| Ohio | 460 |
| North Dakota | 410 |
| Missouri | 370 |
| Utah | 330 |
| Maryland | 320 |
| New Jersey | 320 |
| Wyoming | 320 |
| Mississippi | 300 |
| Illinois | 290 |
| Indiana | 290 |
| Tennessee | 260 |
| Massachusetts | 250 |
| Florida | 230 |
| West Virginia | 230 |
Highest-Paying States for Chemical Plant and System Operators
The highest-paying states for chemical plant and system operators.
| State | Annual Median Salary |
|---|---|
| North Dakota | $112,970 |
| Wyoming | $104,420 |
| Texas | $99,250 |
| Kentucky | $98,890 |
| Louisiana | $96,500 |
| Maryland | $92,930 |
| New Jersey | $88,550 |
| California | $88,280 |
| Alabama | $84,490 |
| Pennsylvania | $75,660 |
Skills
Top chemical plant and system operators skills, rated on an importance scale of 0 to 5:
Knowledge Areas
Core knowledge areas for this occupation, rated on an importance scale of 0 to 5:
Abilities
Top abilities for chemical plant and system operators, rated on an importance scale of 0 to 5:
Daily Tasks
Day-to-day, chemical plant and system operators typically:
- Monitor recording instruments, flowmeters, panel lights, or other indicators and listen for warning signals to verify conformity of process conditions.
- Regulate or shut down equipment during emergency situations, as directed by supervisory personnel.
- Control or operate chemical processes or systems of machines, using panelboards, control boards, or semi-automatic equipment.
- Move control settings to make necessary adjustments on equipment units affecting speeds of chemical reactions, quality, or yields.
- Inspect operating units, such as towers, soap-spray storage tanks, scrubbers, collectors, or driers to ensure that all are functioning and to maintain maximum efficiency.
- Draw samples of products and conduct quality control tests to monitor processing and to ensure that standards are met.
- Record operating data, such as process conditions, test results, or instrument readings.
- Patrol work areas to ensure that solutions in tanks or troughs are not in danger of overflowing.
- Turn valves to regulate flow of products or byproducts through agitator tanks, storage drums, or neutralizer tanks.
- Interpret chemical reactions visible through sight glasses or on television monitors and review laboratory test reports for process adjustments.
- Confer with technical and supervisory personnel to report or resolve conditions affecting safety, efficiency, or product quality.
- Start pumps to wash and rinse reactor vessels, to exhaust gases or vapors, to regulate the flow of oil, steam, air, or perfume to towers, or to add products to converter or blending vessels.
Work Activities
- Getting Information
- Monitoring Processes, Materials, or Surroundings
- Identifying Objects, Actions, and Events
- Controlling Machines and Processes
- Training and Teaching Others
- Evaluating Information to Determine Compliance with Standards
- Inspecting Equipment, Structures, or Materials
- Making Decisions and Solving Problems
- Communicating with Supervisors, Peers, or Subordinates
- Working with Computers
- Documenting/Recording Information
- Performing General Physical Activities
Tools & Technology
Technologies frequently used: Hot technologies: Microsoft Excel In-demand technologies: Microsoft Excel
What Major Will Prepare You For This Career?
Several college majors map to this occupation:
- Physical Science Technicians
Featured schools near , edit
Related Careers
Careers similar to chemical plant and system operators include:
- Chemical Engineers
- Chemists
- Chemical Technicians
- Industrial Machinery Mechanics
- Metal-Refining Furnace Operators and Tenders
- Heat Treating Equipment Setters, Operators, and Tenders, Metal and Plastic
Also Known As
Ammonia Still Operator, Ammonia Technician, Badger Distiller Operator, Bucket Wash Operator, Chemical Operator, Chemical Plant Operator, Chemical Process Operator, Chemical Production Operator, Chemical Treatment Plant Technician, Denitrator, Front Wash Operator, Furnace Plant Operator, Furnace Process Plant Operator, Furnace Utility Operator, Hydrogenation Operator.
References
- U.S. Bureau of Labor Statistics, Occupational Employment and Wage Statistics — https://www.bls.gov/oes/
- O*NET Online — https://www.onetonline.org/
- BLS Employment Projections — https://www.bls.gov/emp/
- O*NET-SOC code: 51-8091.00
Course Advisor provides higher-education, college and university, degree, program, career, salary, and other helpful information to students, faculty, institutions, and other internet audiences. Presented information and data are subject to change. Inclusion on this website does not imply or represent a direct relationship with the company, school, or brand. Information, though believed correct at time of publication, may not be correct, and no warranty is provided. Contact the schools to verify any information before relying on it. Financial aid may be available for those who qualify. The displayed options may include sponsored or recommended results, not necessarily based on your preferences.
© Course Advisor – All Rights Reserved.