Mental Health Services Schools in South Carolina
In 2022-2023, 90 students earned their Mental Health Services degrees in SC.
A Mental Health Services major is the 114th most popular major in this state.
Featured Mental & Social Health Services Programs
Learn about start dates, transferring credits, availability of financial aid, and more by contacting the universities below.
BA in Psychology - Mental Health
Gain a strong foundation in the concepts involved with mental health therapy and assessment with this specialized online bachelor's from Southern New Hampshire University.
BS in Community Health Education
Focus on improving the health of individuals based on their lifestyle needs with this specialized online bachelor's from Southern New Hampshire University.
Education Levels of Mental Health Services Majors in South Carolina
Mental Health Services majors in the state tend to have the following degree levels:
| Education Level | Number of Grads |
|---|---|
| Master’s Degree | 50 |
| Bachelor’s Degree | 24 |
| Post-Master’s Certificate | 15 |
| Postbaccalaureate Certificate | 15 |
| Award Taking 1 to 2 Years | 1 |
| Award Taking 2 to 4 Years | 1 |
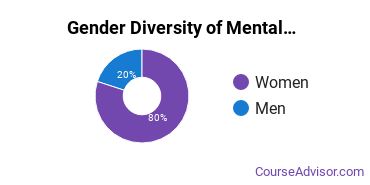
Gender Distribution
In South Carolina, a mental health services major is more popular with women than with men.

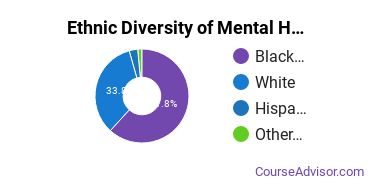
Racial Distribution
The racial distribution of mental health services majors in South Carolina is as follows:
- Asian: 0.0%
- Black or African American: 51.1%
- Hispanic or Latino: 2.2%
- White: 43.3%
- Non-Resident Alien: 0.0%
- Other Races: 3.3%

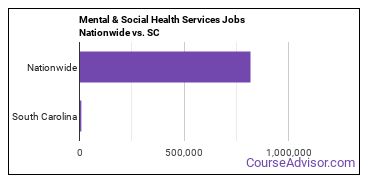
Jobs for Mental Health Services Grads in South Carolina
In this state, there are 6,460 people employed in jobs related to a mental health services degree, compared to 817,510 nationwide.

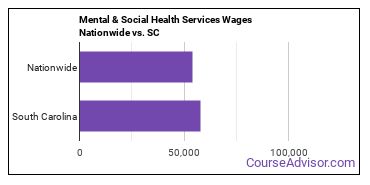
Wages for Mental Health Services Jobs in South Carolina
A typical salary for a mental health services grad in the state is $57,660, compared to a typical salary of $54,150 nationwide.

Most Popular Mental Health Services Programs in SC
There are 4 colleges in South Carolina that offer mental health services degrees. Learn about the most popular 4 below:
Seeking financial aid? At this school, 87% of students receive it. This private institution charges an average net price of $24,139. It takes the average student 4.25 years to graduate.
Request Information74% of the teachers are full time. A typical student attending UofSC will pay a net price of $21,044. The student to faculty ratio is 18 to 1.
Request InformationStudents who attend this private institution pay an average net price of $19,737. Students enjoy a student to faculty ratio of 9 to 1. 99% of students get financical aid.
Request Information100% of students get financical aid. The student to faculty ratio is 10 to 1. This private institution charges an average net price of $18,671.
Request InformationMental Health Services Careers in SC
Some of the careers mental health services majors go into include:
| Job Title | SC Job Growth | SC Median Salary |
|---|---|---|
| Social Work Professors | 22% | $0 |
| Clergy | 17% | $49,780 |
| Psychiatric Technicians | 7% | $32,540 |
Related Majors in South Carolina
Below are some popular majors in the state that are similar to mental health services.
| Major | Annual Graduates in SC |
|---|---|
| Nursing | 3,296 |
| Public Health | 859 |
| Allied Health Professions | 644 |
| Medicine | 381 |
| Pharmacy/Pharmaceutical Sciences | 329 |
| Health/Medical Admin Services | 302 |
| Allied Health Services | 204 |
| Rehabilitation Professions | 202 |
View all majors related to Mental Health Services
Explore Major by State
Alabama
Arkansas
Connecticut
Florida
Idaho
Iowa
Louisiana
Massachusetts
Mississippi
Nebraska
New Jersey
North Carolina
Oklahoma
Rhode Island
Tennessee
Vermont
West Virginia
View Nationwide Mental Health Services Report
References
More about our data sources and methodologies.


