Graduate Certificates in Engineering Physics
Education Levels of Engineering Physics Majors
During the most recent year for which data is available, 87 people earned their graduate certificate in engineering physics. This makes it the 111th most popular graduate certificate program in the country.
The following table shows the number of diplomas awarded in engineering physics at each degree level.
| Education Level | Number of Grads |
|---|---|
| Bachelor’s Degree | 691 |
| Master’s Degree | 203 |
| Graduate Certificate | 87 |
| Doctor’s Degree | 55 |
| Associate Degree | 11 |
Earnings of Engineering Physics Majors With Graduate Certificates
We are unable to calculate the median earnings for engineering physics majors with their graduate certificate due to lack of data.
Student Debt
The data on debt ranges for engineering physics majors who have their graduate certificate is not available.
Student Diversity
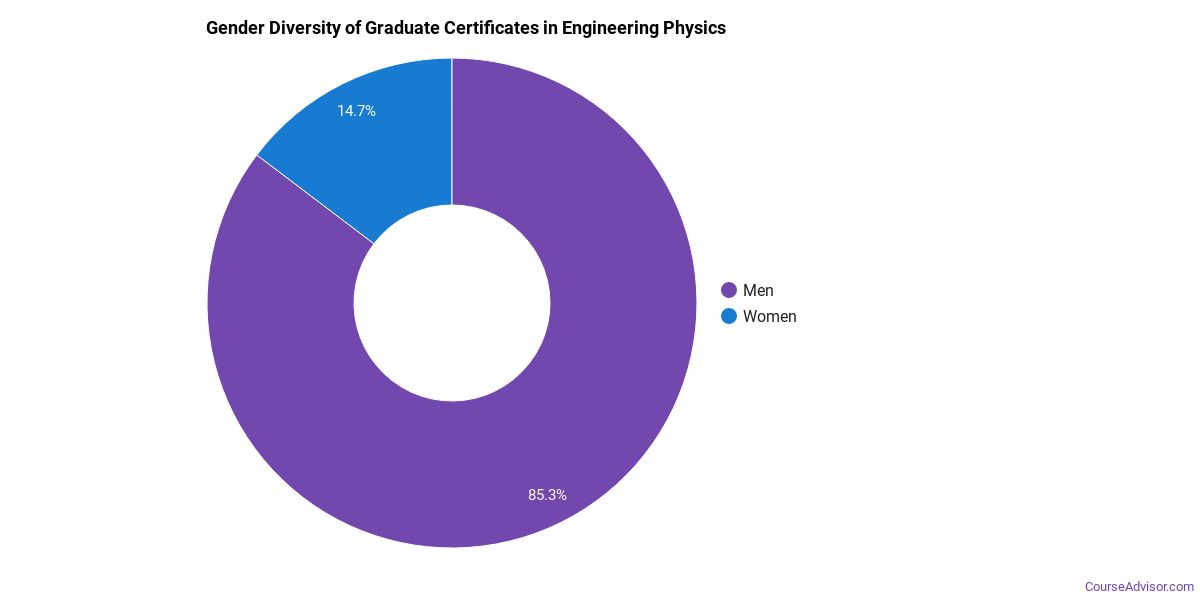
More men than women pursue graduate certificates in engineering physics. About 79.3% of graduates in this field are male.
| Gender | Number of Grads |
|---|---|
| Men | 69 |
| Women | 18 |
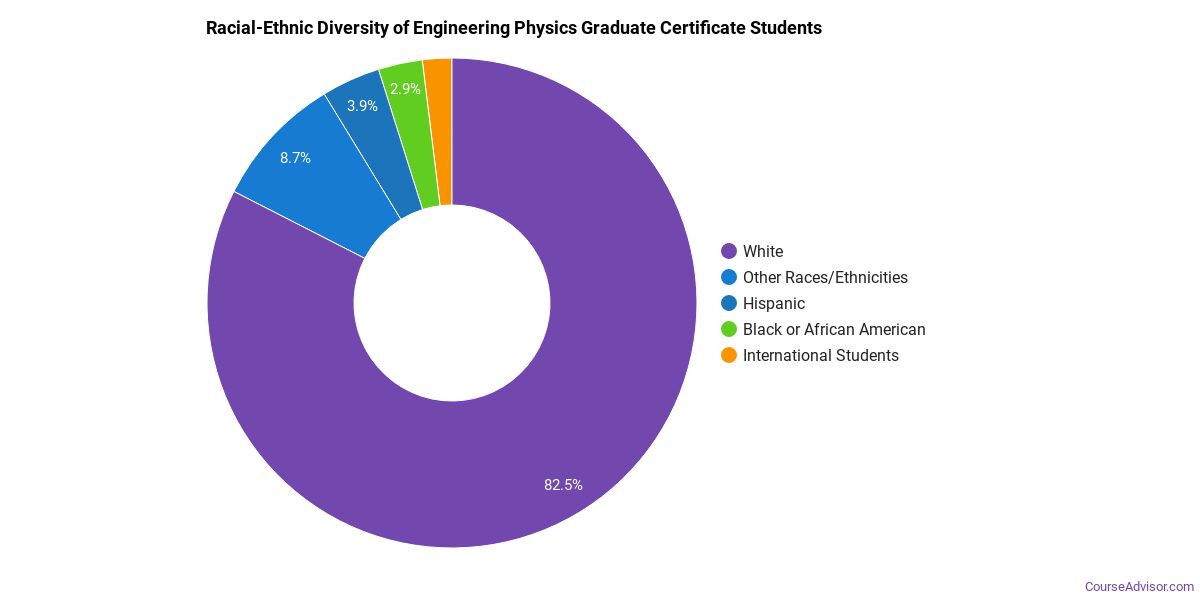
The racial-ethnic distribution of engineering physics graduate certificate students is as follows:
| Race/Ethnicity | Number of Grads |
|---|---|
| Asian | 4 |
| Black or African American | 3 |
| Hispanic or Latino | 5 |
| White | 60 |
| International Students | 4 |
| Other Races/Ethnicities | 11 |
Most Popular Engineering Physics Programs for Graduate Certificates
There are 5 colleges that offer a graduate certificate in engineering physics. Learn more about the most popular 5 below:

Air Force Institute of Technology - Graduate School of Engineering & Management
Air Force Institute of Technology - Graduate School of Engineering & Management tops the list of the most popular school in the U.S. for engineering physics majors who are seeking their graduate certificate. Each year, around 1,100 students seeking various degrees attend the university. During the most recent year for which we have data, 102 people received their graduate certificate in engineering physics from AFIT Graduate School of Engineering & Management. Around 21% of these students were from an underrepresented racial-ethnic group, and 21% were women.

The 2nd most popular school in the country for engineering physics majors who are seeking their graduate certificate is Columbia University in the City of New York. Roughly 30,100 attend the school each year. The average in-state tuition for full-time undergraduates is $64,526 per year, while in-state graduate students, on average, pay $53,576 per year. During the most recent year for which we have data, 5 people received their graduate certificate in engineering physics from Columbia. Of these students, 25% were women and 13% were members of underrepresented racial-ethnic groups.

The 4th most popular school in the country for engineering physics majors who are seeking their graduate certificate is Colorado School of Mines. The average in-state tuition for full-time undergraduates is $18,390 per year, while in-state graduate students, on average, pay $18,558 per year. During the most recent year for which we have data, 0 people received their graduate certificate in engineering physics from Mines.
Explore Major by State
Alabama
Arkansas
Connecticut
Florida
Idaho
Iowa
Louisiana
Massachusetts
Mississippi
Nebraska
New Jersey
North Carolina
Oklahoma
Rhode Island
Tennessee
Vermont
West Virginia
Related Majors
Below are some popular majors that are similar to engineering physics that offer graduate certificates.
| Major | Annual Degrees Awarded |
|---|---|
| Systems Engineering | 768 |
| Industrial Engineering | 217 |
| Other Engineering | 215 |
| Operations Research | 178 |
| Electrical Engineering | 153 |
References
*The racial-ethnic minority student count is calculated by taking the total number of students and subtracting white students, international students, and students whose race/ethnicity was unknown. This number is then divided by the total number of students at the school to obtain the percentage of racial-ethnic minorities.
- College Factual
- National Center for Education Statistics
- O*NET Online
- Bureau of Labor Statistics
- Image Credit: By NASA under License
More about our data sources and methodologies.
Course Advisor provides higher-education, college and university, degree, program, career, salary, and other helpful information to students, faculty, institutions, and other internet audiences. Presented information and data are subject to change. Inclusion on this website does not imply or represent a direct relationship with the company, school, or brand. Information, though believed correct at time of publication, may not be correct, and no warranty is provided. Contact the schools to verify any information before relying on it. Financial aid may be available for those who qualify. The displayed options may include sponsored or recommended results, not necessarily based on your preferences.
© Course Advisor – All Rights Reserved.