Graduate Certificates in Agricultural Public Services
Education Levels of Agricultural Public Services Majors
During the most recent year for which data is available, 19 people earned their graduate certificate in agricultural public services. This makes it the 243rd most popular graduate certificate program in the country.
The following table shows the number of diplomas awarded in agricultural public services at each degree level.
| Education Level | Number of Grads |
|---|---|
| Bachelor’s Degree | 607 |
| Master’s Degree | 199 |
| Doctor’s Degree | 19 |
| Graduate Certificate | 19 |
| Basic Certificate | 14 |
| Associate Degree | 8 |
Earnings of Agricultural Public Services Majors With Graduate Certificates
At this time, we do not have the data to estimate the median earnings for this class of people.
Student Debt
We do not have the data to estimate the median debt for this class of people.
Student Diversity
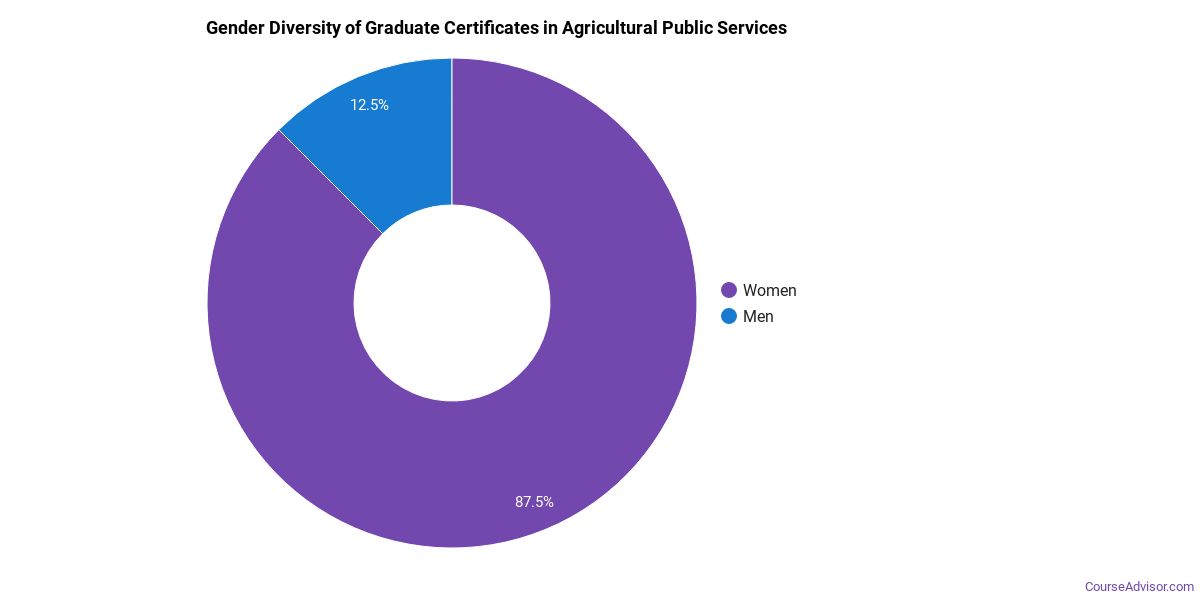
More women than men pursue their graduate certificate in agricultural public services. About 73.7% of graduates with this degree are female.
| Gender | Number of Grads |
|---|---|
| Men | 5 |
| Women | 14 |
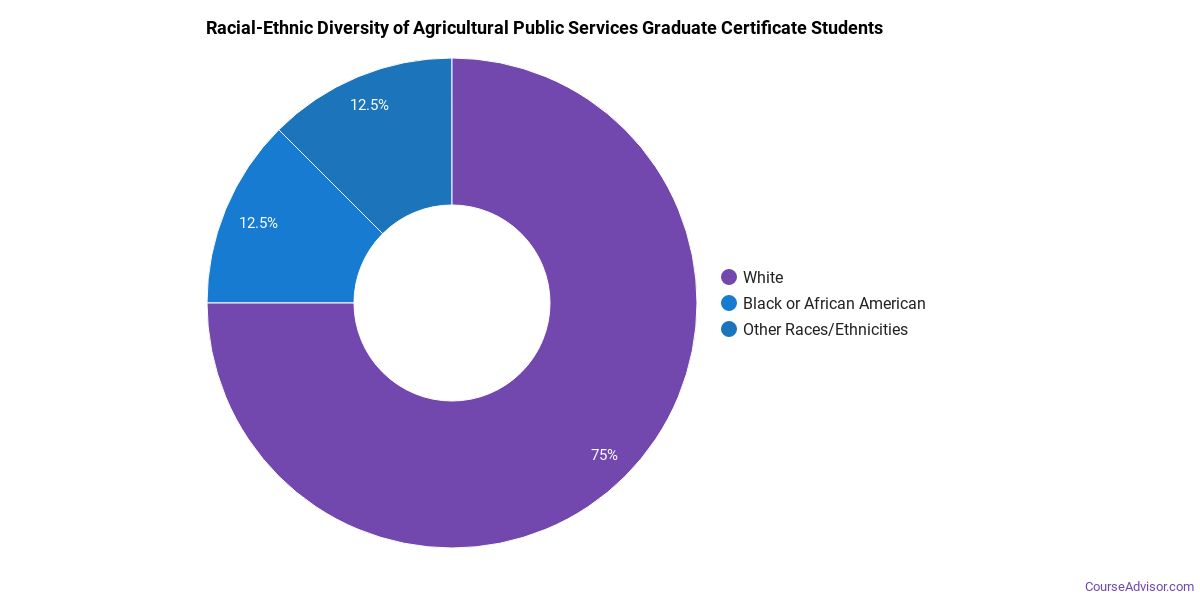
The racial-ethnic distribution of agricultural public services graduate certificate students is as follows:
| Race/Ethnicity | Number of Grads |
|---|---|
| Asian | 0 |
| Black or African American | 0 |
| Hispanic or Latino | 0 |
| White | 18 |
| International Students | 0 |
| Other Races/Ethnicities | 1 |
Most Popular Agricultural Public Services Programs for Graduate Certificates
There are 6 colleges that offer a graduate certificate in agricultural public services. Learn more about the most popular 6 below:

North Carolina State University tops the list of the most popular school in the U.S. for agricultural public services majors who are seeking their graduate certificate. Each year, around 36,000 students seeking various degrees attend the university. The average in-state tuition for full-time undergraduates is $6,535 per year, while in-state graduate students, on average, pay $9,459 per year. During the most recent year for which we have data, 4 people received their graduate certificate in agricultural public services from NC State. About 80% of this group were women, and 20% were students from an underrepresented racial-ethnic group.

Colorado State University - Fort Collins is the 2nd most popular school in the nation for students seeking a graduate certificate in agricultural public services. The average in-state tuition for full-time undergraduates is $10,299 per year, while in-state graduate students, on average, pay $11,159 per year. During the most recent year for which we have data, 2 people received their graduate certificate in agricultural public services from Colorado State.

Texas A&M University - College Station is the 2nd most popular school in the nation for students seeking a graduate certificate in agricultural public services. The average in-state tuition for full-time undergraduates is $9,003 per year, while in-state graduate students, on average, pay $6,885 per year. During the most recent year for which we have data, 2 people received their graduate certificate in agricultural public services from Texas A&M College Station.

The 4th most popular school in the country for agricultural public services majors who are seeking their graduate certificate is Texas Tech University. Each year, around 40,300 students seeking various degrees attend the university. The average in-state tuition for full-time undergraduates is $8,935 per year, while in-state graduate students, on average, pay $6,956 per year. During the most recent year for which we have data, 0 people received their graduate certificate in agricultural public services from Texas Tech.

Purdue University - Main Campus comes in at #4 on our list of the most popular colleges offering graduate certificates in agricultural public services. The average in-state tuition for full-time undergraduates is $9,718 per year, while in-state graduate students, on average, pay $9,718 per year. During the most recent year for which we have data, 0 people received their graduate certificate in agricultural public services from Purdue.
Explore Major by State
Alabama
Arkansas
Connecticut
Florida
Idaho
Iowa
Louisiana
Massachusetts
Mississippi
Nebraska
New Jersey
North Carolina
Oklahoma
Rhode Island
Tennessee
Vermont
West Virginia
Related Majors
Below are some popular majors that are similar to agricultural public services that offer graduate certificates.
| Major | Annual Degrees Awarded |
|---|---|
| 89 | |
| 86 | |
| Animal Science | 39 |
| International Agriculture | 28 |
| Plant Sciences | 28 |
References
*The racial-ethnic minority student count is calculated by taking the total number of students and subtracting white students, international students, and students whose race/ethnicity was unknown. This number is then divided by the total number of students at the school to obtain the percentage of racial-ethnic minorities.
- College Factual
- National Center for Education Statistics
- O*NET Online
- Bureau of Labor Statistics
- Image Credit: By Bob Nichols under License
More about our data sources and methodologies.
Course Advisor provides higher-education, college and university, degree, program, career, salary, and other helpful information to students, faculty, institutions, and other internet audiences. Presented information and data are subject to change. Inclusion on this website does not imply or represent a direct relationship with the company, school, or brand. Information, though believed correct at time of publication, may not be correct, and no warranty is provided. Contact the schools to verify any information before relying on it. Financial aid may be available for those who qualify. The displayed options may include sponsored or recommended results, not necessarily based on your preferences.
© Course Advisor – All Rights Reserved.