Featured schools near , edit
Types of Degrees Majors Are Getting
The following table lists how many agriculture/veterinary preparatory programs graduations there were in 2020-2021 for each degree level.
| Education Level | Number of Grads |
|---|---|
| Bachelor’s Degree | 478 |
| Associate Degree | 49 |
Who Is Getting a Bachelor’s Degree in ?
Racial-Ethnic Diversity
At the countrywide level, the racial-ethnic distribution of agriculture/veterinary preparatory programs majors is as follows:
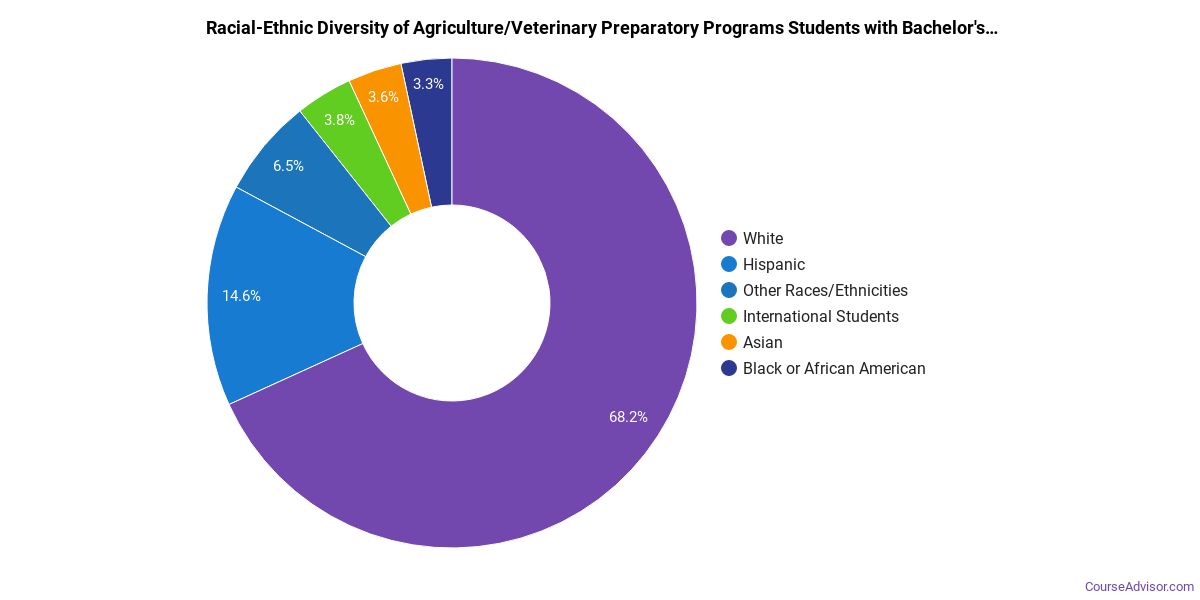
| Race/Ethnicity | Number of Grads |
|---|---|
| Asian | 17 |
| Black or African American | 16 |
| Hispanic or Latino | 70 |
| White | 326 |
| International Students | 18 |
| Other Races/Ethnicities | 31 |
Geographic Diversity
Students from other countries are interested in Agriculture/Veterinary Preparatory Programs, too. About 3.8% of those with this major are international students.
Online Programs
In 2020-2021, 56 schools offered a agriculture/veterinary preparatory programs program of some type. The following table lists the number of programs by degree level, along with how many schools offered online courses in the field.
| Degree Level | Colleges Offering Programs | Colleges Offering Online Classes |
|---|---|---|
| Certificate (Less Than 1 Year) | 0 | 0 |
| Certificate (1-2 years) | 1 | 0 |
| Certificate (2-4 Years) | 1 | 0 |
| Associate’s Degree | 22 | 0 |
| Bachelor’s Degree | 0 | 0 |
| Post-Baccalaureate | 0 | 0 |
| Master’s Degree | 0 | 0 |
| Post-Master’s | 0 | 0 |
| Doctor’s Degree (Research) | 0 | 0 |
| Doctor’s Degree (Professional Practice) | 0 | 0 |
| Doctor’s Degree (Other) | 0 | 0 |
Top Ranking Lists for <nil>
Explore Major by State
Alabama
California
District of Columbia
Idaho
Kansas
Maryland
Mississippi
Nevada
New York
Oklahoma
South Carolina
Utah
West Virginia
Alaska
Colorado
Florida
Illinois
Kentucky
Massachusetts
Missouri
New Hampshire
North Carolina
Oregon
South Dakota
Vermont
Wisconsin
Majors Related to
You may also be interested in one of the following majors related to agriculture/veterinary preparatory programs.
| Major | Number of Grads |
|---|---|
| Veterinary/Animal Health Technologies/Technicians | 8,646 |
| Animal Science | 8,294 |
| Agricultural Economics & Business | 8,098 |
| General Agriculture | 3,370 |
| Horticulture | 3,234 |
| Plant Sciences | 3,175 |
| Agricultural Production | 3,066 |
| Food Science Technology | 2,532 |
| Agricultural Mechanization | 1,280 |
| Animal Services | 990 |
| Agricultural Public Services | 845 |
| Other Agriculture | 602 |
| Soil Sciences | 406 |
| Food Processing | 237 |
| International Agriculture | 122 |
| Veterinary Administrative Services | 118 |
References
*The racial-ethnic minorities count is calculated by taking the total number of students and subtracting white students, international students, and students whose race/ethnicity was unknown. This number is then divided by the total number of students at the school to obtain the racial-ethnic minorities percentage.
- College Factual
- College Scorecard
- National Center for Education Statistics
- O*NET Online
- U.S. Bureau of Labor Statistics
- Usual Weekly Earnings of Wage and Salary Workers First Quarter 2020
More about our data sources and methodologies.
Featured Schools
 Request Info
|
Southern New Hampshire University You have goals. Southern New Hampshire University can help you get there. Whether you need a bachelor's degree to get into a career or want a master's degree to move up in your current career, SNHU has an online program for you. Find your degree from over 200 online programs. Learn More > |
Course Advisor provides higher-education, college and university, degree, program, career, salary, and other helpful information to students, faculty, institutions, and other internet audiences. Presented information and data are subject to change. Inclusion on this website does not imply or represent a direct relationship with the company, school, or brand. Information, though believed correct at time of publication, may not be correct, and no warranty is provided. Contact the schools to verify any information before relying on it. Financial aid may be available for those who qualify. The displayed options may include sponsored or recommended results, not necessarily based on your preferences.
© Course Advisor – All Rights Reserved.