Wor-Wic Community College Overview
Wor-Wic Community College is a public institution located in Salisbury, Maryland. Students who love country life may enjoy the rural location of Wor-Wic Community College.
What Is Wor-Wic Community College Known For?
- The associate's degree is the highest award offered at Wor-Wic Community College.
- During a recent academic cycle, 52% of the faculty were full-time.
Where Is Wor-Wic Community College?
Contact details for Wor-Wic Community College are given below.
| Contact Details | |
|---|---|
| Address: | 32000 Campus Drive, Salisbury, MD 21804-7131 |
| Phone: | 410-334-2800 |
| Website: | www.worwic.edu |
How Do I Get Into Wor-Wic Community College?
You can apply to Wor-Wic Community College online at: https://www.worwic.edu/Apply-Register/Apply-to-Wor-Wic
Can I Afford Wor-Wic Community College?
Student Loan Debt
Almost 66% of college students who graduated with the class of 2018 took out student loans, but that percentage varies from school to school. At Wor-Wic Community College, approximately 17% of students took out student loans averaging $2,907 a year. That adds up to $11,628 over four years for those students.
Explore Best Ranked Schools for You
Wor-Wic Community College Undergraduate Student Diversity
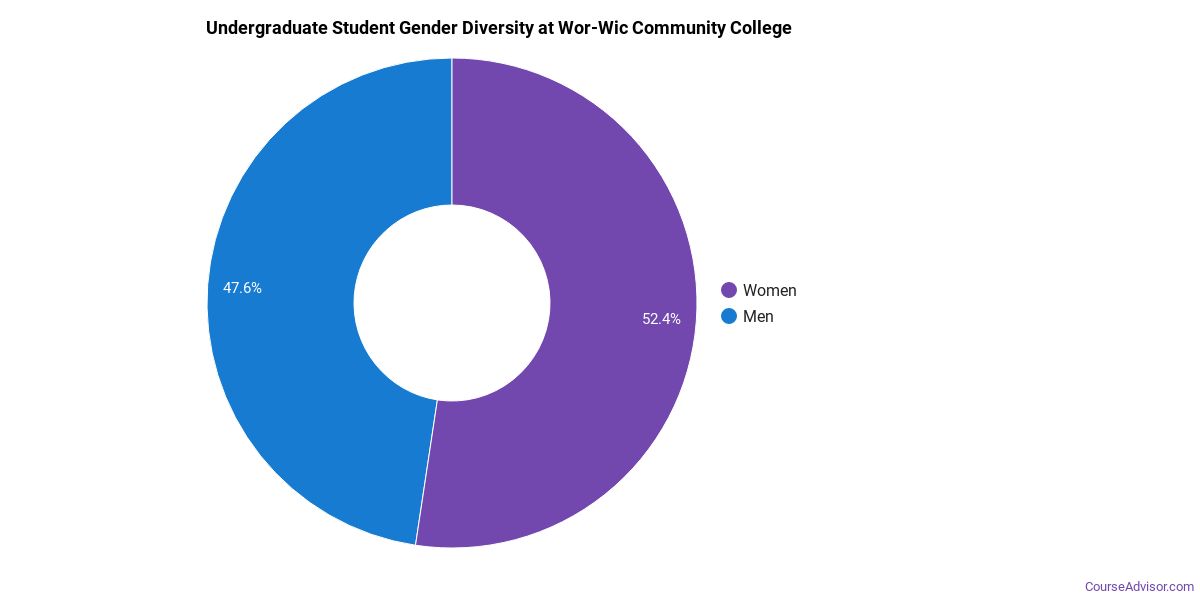
Gender Diversity
Of the 667 full-time undergraduates at Wor-Wic Community College, 45% are male and 55% are female.
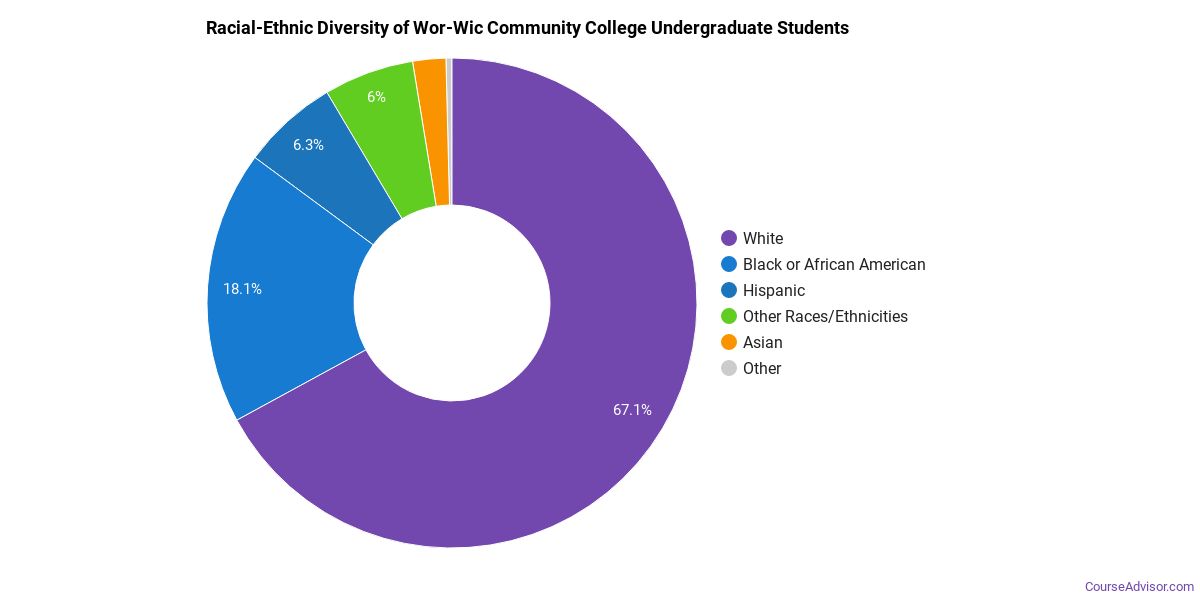
Racial-Ethnic Diversity
The racial-ethnic breakdown of Wor-Wic Community College students is as follows.
| Race/Ethnicity | Number of Grads |
|---|---|
| Asian | 18 |
| Black or African American | 128 |
| Hispanic or Latino | 41 |
| White | 427 |
| International Students | 2 |
| Other Races/Ethnicities | 51 |
Wor-Wic Community College Undergraduate Concentrations
The table below shows the number of awards for each concentration.
| Major | Basic Certificate | Associate’s | Undergraduate Certificate | TOTAL |
|---|---|---|---|---|
| Criminal Justice & Corrections | 97 | 12 | 0 | 109 |
| Liberal Arts General Studies | 0 | 102 | 0 | 102 |
| Nursing | 0 | 84 | 0 | 84 |
| Practical Nursing & Nursing Assistants | 0 | 0 | 61 | 61 |
| Mental & Social Health Services | 0 | 23 | 1 | 24 |
| Allied Health & Medical Assisting Services | 0 | 23 | 0 | 23 |
| General Business/Commerce | 0 | 18 | 0 | 18 |
| Allied Health Professions | 0 | 16 | 2 | 18 |
| Teacher Education Grade Specific | 0 | 16 | 0 | 16 |
| Human Development & Family Studies | 2 | 13 | 0 | 15 |
| Computer Systems Analysis | 0 | 9 | 2 | 11 |
| Business Administration & Management | 1 | 8 | 0 | 9 |
| Other Science Technologies/Technicians | 0 | 8 | 0 | 8 |
| Business Support & Assistant Services | 0 | 3 | 0 | 3 |
| Hospitality Management | 1 | 2 | 0 | 3 |
| Computer Information Systems | 0 | 2 | 0 | 2 |
| General Education | 0 | 2 | 0 | 2 |
| Insurance | 0 | 0 | 0 | 0 |
| Electromechanical Engineering Technology | 0 | 0 | 0 | 0 |
| Heating, Air Conditioning, Ventilation & Refrigeration | 0 | 0 | 0 | 0 |
| Culinary Arts | 0 | 0 | 0 | 0 |
| Precision Metal Working | 0 | 0 | 0 | 0 |
| Fire Protection | 0 | 0 | 0 | 0 |
| TOTAL | 101 | 341 | 66 | 508 |
References
*The racial-ethnic minorities count is calculated by taking the total number of students and subtracting white students, international students, and students whose race/ethnicity was unknown. This number is then divided by the total number of students at the school to obtain the racial-ethnic minorities percentage.
More about our data sources and methodologies.
Course Advisor provides higher-education, college and university, degree, program, career, salary, and other helpful information to students, faculty, institutions, and other internet audiences. Presented information and data are subject to change. Inclusion on this website does not imply or represent a direct relationship with the company, school, or brand. Information, though believed correct at time of publication, may not be correct, and no warranty is provided. Contact the schools to verify any information before relying on it. Financial aid may be available for those who qualify. The displayed options may include sponsored or recommended results, not necessarily based on your preferences.
© Course Advisor – All Rights Reserved.