Romance Languages at Wofford College
What traits are you looking for in a school for Romance Languages, consider the program at Wofford College. The following information will help you decide if it is a good fit for you.
Wofford College sits in Spartanburg, SC.
During the most recent reporting year, 38 romance languages degrees were granted at Wofford College.
Featured schools near , edit
Online & Distance Learning at Wofford College
Wofford College delivers most coursework on campus; distance-education enrollment is limited.
Romance Languages Rankings at Wofford College
Use these rankings to compare Wofford College’s Romance Languages program against other schools offering the same major.
Bachelor’s-Level Rankings
| Ranking | Scope | Rank |
|---|---|---|
| Best Value | South Carolina | #3 of 4 |
| Best Schools (Quality) | South Carolina | #4 of 4 |
| Best Schools (Quality) | Southeast (Region) | #19 of 32 |
| Best Value | Southeast (Region) | #30 of 32 |
| Best Schools (Quality) | Nationwide | #149 of 211 |
| Best Value | Nationwide | #189 of 209 |
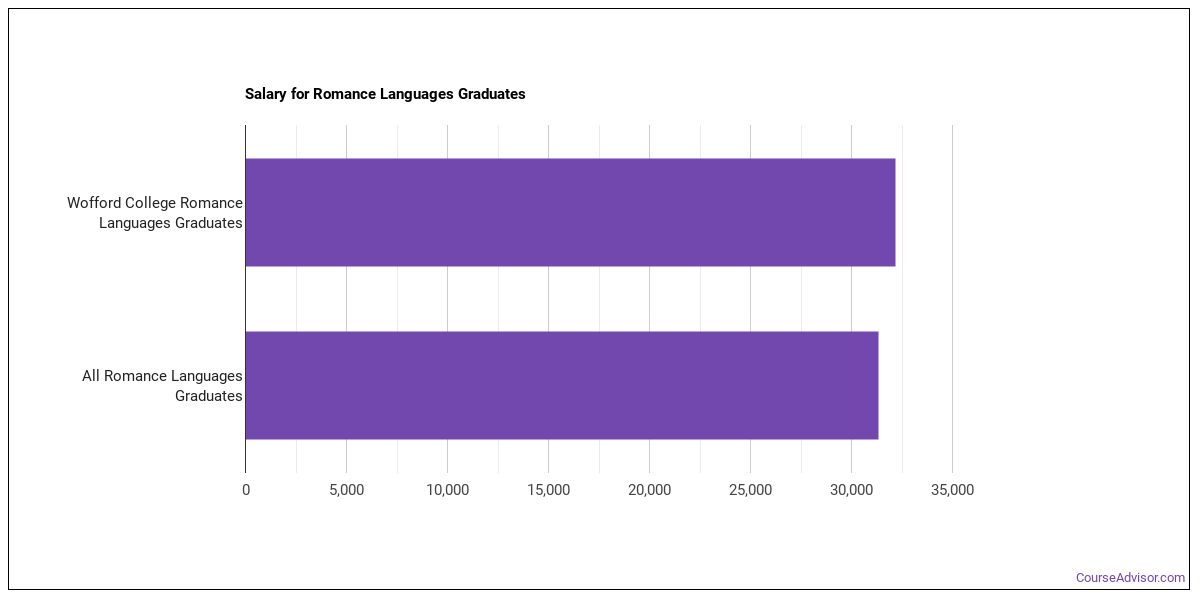
Earnings for Romance Languages Graduates from Wofford College
Graduates of Wofford College’s Romance Languages program earn at the following median levels (per the U.S. Department of Education’s College Scorecard):
| Years After Graduation | Median Earnings |
|---|---|
| 1 year | $32,197 |
| 2 years | $34,526 |
| 3 years | $43,254 |
| 4 years | $60,531 |
| 5 years | $54,450 |
Is this above or below average for the school? Four years out, Romance Languages graduates from Wofford College take home a median $60,531, compared with $58,388 for all Wofford College graduates — about 4% higher than the school-wide median.

Median Debt at Graduation
Typical debt at graduation for Romance Languages graduates from Wofford College is $25,269.
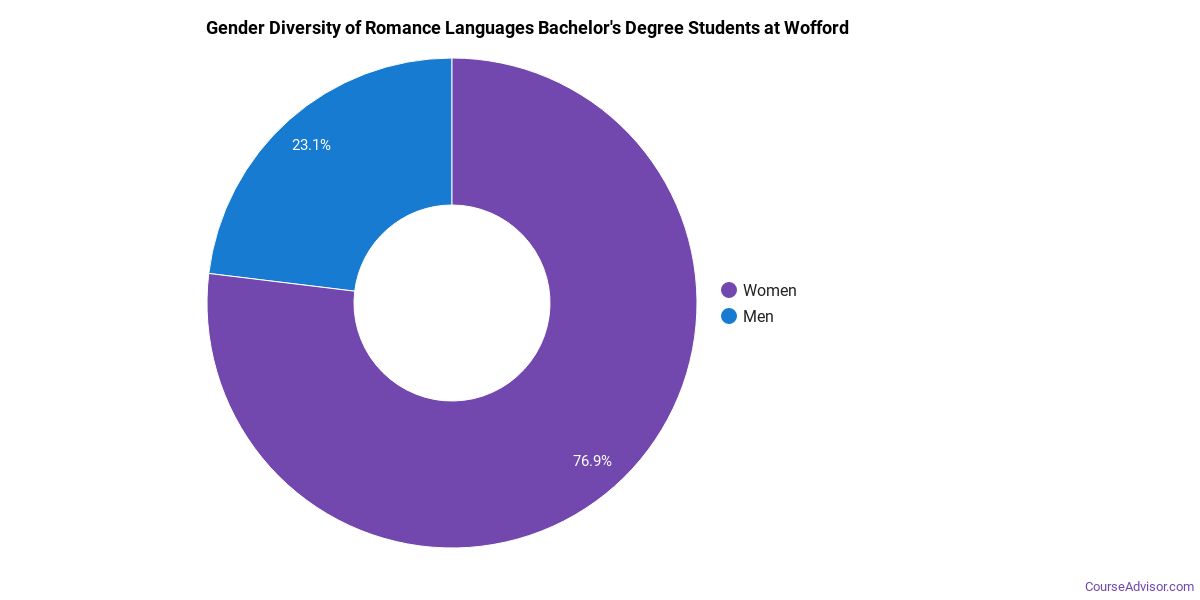
Student Demographics & Diversity
Below you’ll find the student demographics for Romance Languages graduates at Wofford College, by degree type.
Across all degree levels, Romance Languages graduates at Wofford College are 82% women (31) and 18% men (7).
Romance Languages Bachelor’s Program at Wofford College
Among the 38 bachelor’s romance languages graduates at Wofford College, 82% were women (31) and 18% were men (7).
The following table and chart show the race/ethnicity of Romance Languages bachelor’s degree recipients at Wofford College.
| Race / Ethnicity | Number of Graduates |
|---|---|
| White | 28 |
| Hispanic / Latino | 9 |
| Black / African American | 1 |
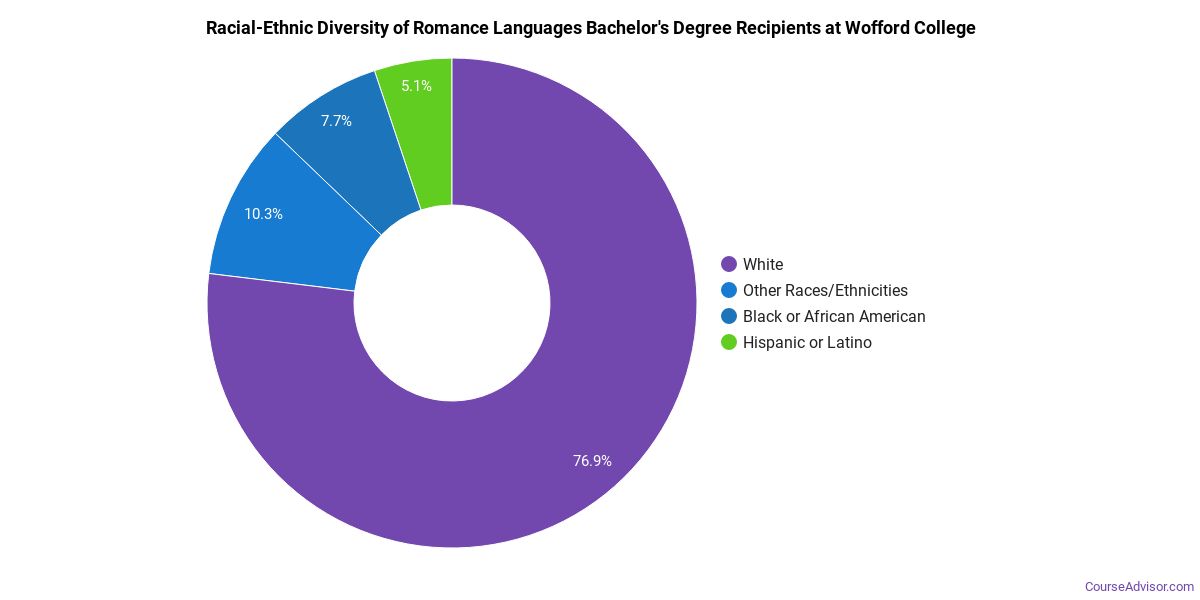
Minority students account for 26% of Romance Languages bachelor’s degree recipients at Wofford College, below the national average of 45%.*
*The racial-ethnic minorities figure is the total number of graduates minus White, international (nonresident), and unknown-race graduates.
More Specific Romance Languages Concentrations at Wofford College
The Romance Languages program at Wofford College breaks down into more specific concentrations:
| Concentration | Graduates |
|---|---|
| French Language & Literature | 7 |
| Spanish Language & Literature | 31 |
Best-Paid Careers for Romance Languages Graduates
Graduates of the Romance Languages program at Wofford College work across a variety of fields. The table below ranks the top-paying careers for Romance Languages graduates, ordered by median annual salary:
| Occupation | Nationwide Median Wage |
|---|---|
| Secondary School Teachers, Except Special and Career/Technical Education | $77,927 |
| Interpreters and Translators | $52,627 |
| Foreign Language and Literature Teachers, Postsecondary | $39,815 |
References
- IPEDS — Integrated Postsecondary Education Data System
- U.S. Department of Education — College Scorecard
- O*NET Online (Bureau of Labor Statistics)
- National Center for Education Statistics
More about our data sources and methodologies.
Course Advisor provides higher-education, college and university, degree, program, career, salary, and other helpful information to students, faculty, institutions, and other internet audiences. Presented information and data are subject to change. Inclusion on this website does not imply or represent a direct relationship with the company, school, or brand. Information, though believed correct at time of publication, may not be correct, and no warranty is provided. Contact the schools to verify any information before relying on it. Financial aid may be available for those who qualify. The displayed options may include sponsored or recommended results, not necessarily based on your preferences.
© Course Advisor – All Rights Reserved.