Ethnic Studies at Wheaton College (Massachusetts)
If you are interested in studying Ethnic Studies, consider the program at Wheaton College (Massachusetts). We’ve gathered the following information to help you decide.
Wheaton College (Massachusetts) is located in Norton, MA.
In the most recent year for which we have data, 19 ethnic studies graduations were recorded at Wheaton College (Massachusetts).
Featured schools near , edit
Online Class Availability at Wheaton College (Massachusetts)
Wheaton College (Massachusetts) delivers most coursework on campus; distance-education enrollment is limited.
Ethnic Studies Rankings at Wheaton College (Massachusetts)
These rankings give you a sense of how Wheaton College (Massachusetts)’s Ethnic Studies program to other colleges that offer this major.
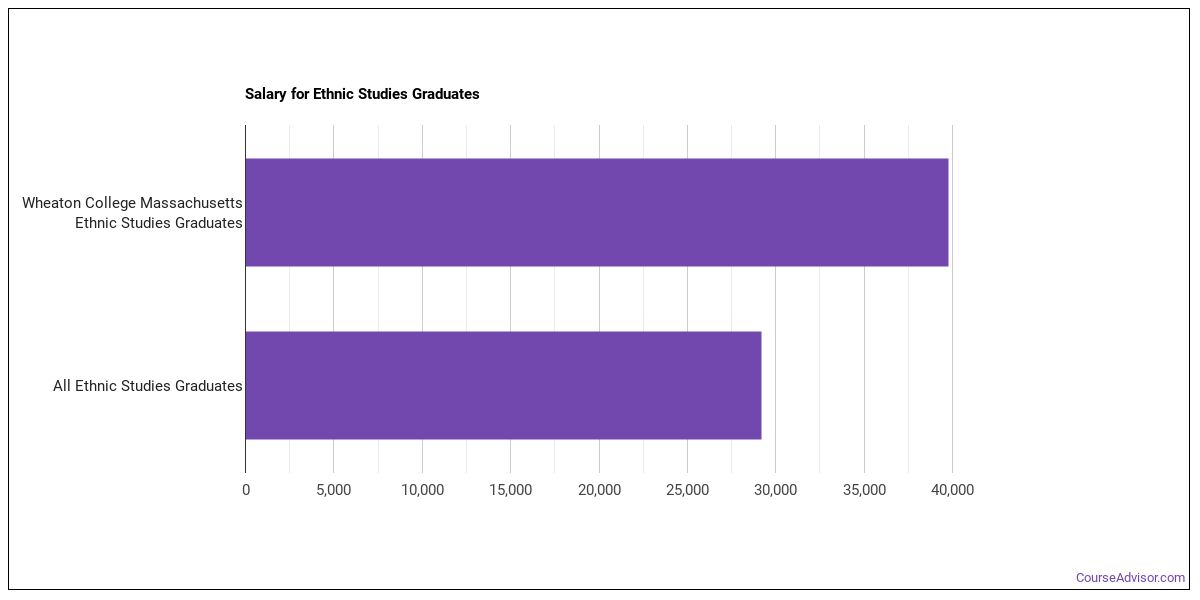
Earnings for Ethnic Studies Graduates from Wheaton College (Massachusetts)
Students who complete Wheaton College (Massachusetts)’s Ethnic Studies program earn at the following median levels (per the U.S. Department of Education’s College Scorecard):
| Years After Graduation | Median Earnings |
|---|---|
| 1 year | $39,761 |
| 2 years | $32,925 |
| 3 years | $40,190 |
| 4 years | $55,761 |
| 5 years | $63,918 |
How do these earnings stack up against the rest of the school? Four years after graduating, Ethnic Studies graduates from Wheaton College (Massachusetts) report median earnings of $55,761, compared with $51,130 for all Wheaton College (Massachusetts) graduates — about 9% higher than the school-wide median.

Median Debt at Graduation
Typical debt at graduation for Ethnic Studies graduates from Wheaton College (Massachusetts) comes in at $25,000.
Student Demographics & Diversity
The following sections describe the composition of Ethnic Studies graduates at Wheaton College (Massachusetts), by degree type.
Looking at the program as a whole, Ethnic Studies graduates at Wheaton College (Massachusetts) are 89% women (17) and 11% men (2).
Ethnic Studies Bachelor’s Program at Wheaton College (Massachusetts)
Among the 19 bachelor’s ethnic studies degrees awarded at Wheaton College (Massachusetts), 89% were women (17) and 11% were men (2).

The following table and chart show the race/ethnicity of Ethnic Studies bachelor’s degree recipients at Wheaton College (Massachusetts).
| Race / Ethnicity | Number of Graduates |
|---|---|
| White | 16 |
| Hispanic / Latino | 2 |
| Unknown | 1 |
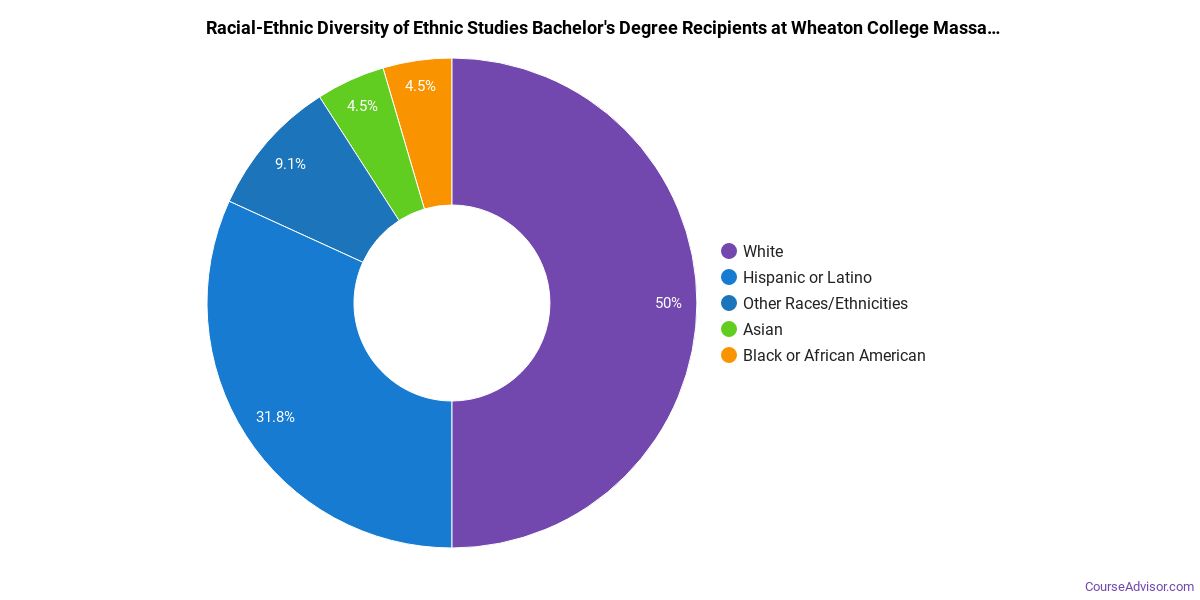
Racial-ethnic minorities make up 11% of Ethnic Studies bachelor’s degree recipients at Wheaton College (Massachusetts), lower than the national average of 66%.*
*The racial-ethnic minorities figure is the total number of graduates minus White, international (nonresident), and unknown-race graduates.
More Specific Ethnic Studies Concentrations at Wheaton College (Massachusetts)
This Ethnic Studies program at Wheaton College (Massachusetts) includes the following sub-specializations:
| Concentration | Graduates |
|---|---|
| Latino Studies | 7 |
| Women’s Studies | 12 |
Best-Paid Careers for Ethnic Studies Graduates
Students who finish Ethnic Studies program at Wheaton College (Massachusetts) pursue many career paths. Below are the top-paying careers for Ethnic Studies graduates, ordered by median annual salary:
| Occupation | Nationwide Median Wage |
|---|---|
| Interpreters and Translators | $52,627 |
| Area, Ethnic, and Cultural Studies Teachers, Postsecondary | $47,517 |
References
- IPEDS — Integrated Postsecondary Education Data System
- U.S. Department of Education — College Scorecard
- O*NET Online (Bureau of Labor Statistics)
- National Center for Education Statistics
More about our data sources and methodologies.
Course Advisor provides higher-education, college and university, degree, program, career, salary, and other helpful information to students, faculty, institutions, and other internet audiences. Presented information and data are subject to change. Inclusion on this website does not imply or represent a direct relationship with the company, school, or brand. Information, though believed correct at time of publication, may not be correct, and no warranty is provided. Contact the schools to verify any information before relying on it. Financial aid may be available for those who qualify. The displayed options may include sponsored or recommended results, not necessarily based on your preferences.
© Course Advisor – All Rights Reserved.