Political Science at Washington University in St Louis
If you plan to study Political Science, you may want to check out the program at Washington University in St Louis. The following information will help you decide if it is a good fit for you.
Washington University in St Louis sits in St. Louis, MO.
In the most recent year for which we have data, 94 political science degrees were awarded at Washington University in St Louis.
Featured schools near , edit
Online & Distance Learning at Washington University in St Louis
Distance learning is available at Washington University in St Louis. Among 16,357 students, 678 (4%) studied exclusively online and 713 (4%) took at least some classes online.
Student Demographics & Diversity
Below you’ll find the composition of Political Science graduates at Washington University in St Louis, broken down by degree level.
Across all degree levels, Political Science graduates at Washington University in St Louis are 41% women (39) and 59% men (55).
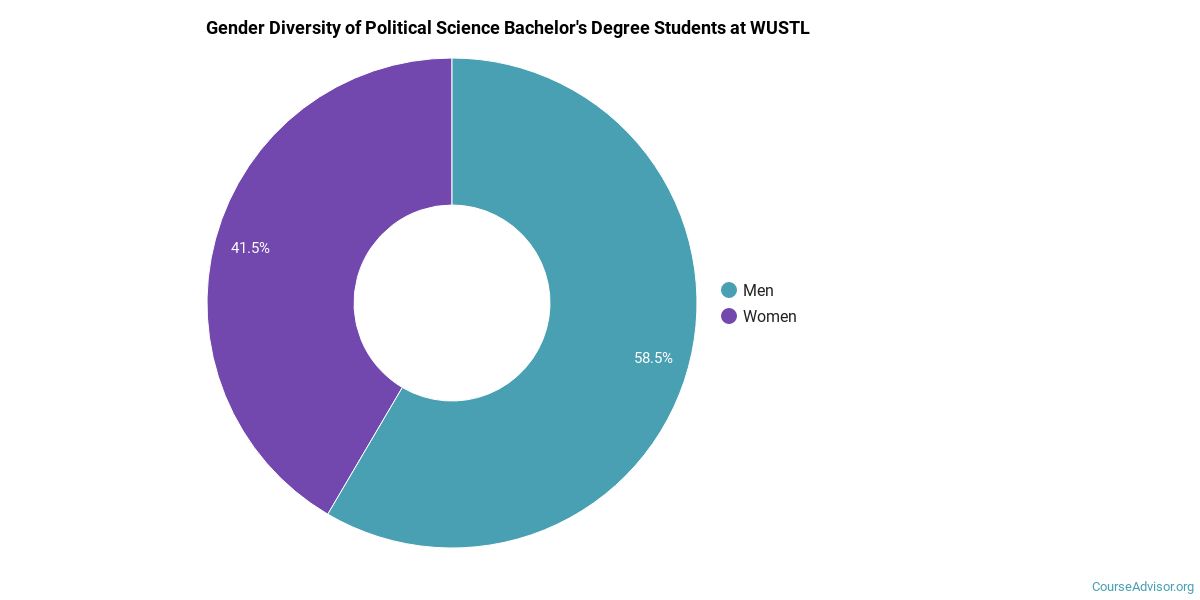
Political Science Bachelor’s Program at Washington University in St Louis
Among the 82 bachelor’s political science degrees awarded at Washington University in St Louis, 45% were women (37) and 55% were men (45).
The following table and chart show the race/ethnicity of Political Science bachelor’s degree recipients at Washington University in St Louis.
| Race / Ethnicity | Number of Graduates |
|---|---|
| White | 52 |
| Hispanic / Latino | 15 |
| Black / African American | 1 |
| Asian | 6 |
| Two or More Races | 4 |
| International (Nonresident) | 1 |
| Unknown | 3 |

Minority students account for 32% of Political Science bachelor’s degree recipients at Washington University in St Louis, below the national average of 41%.*
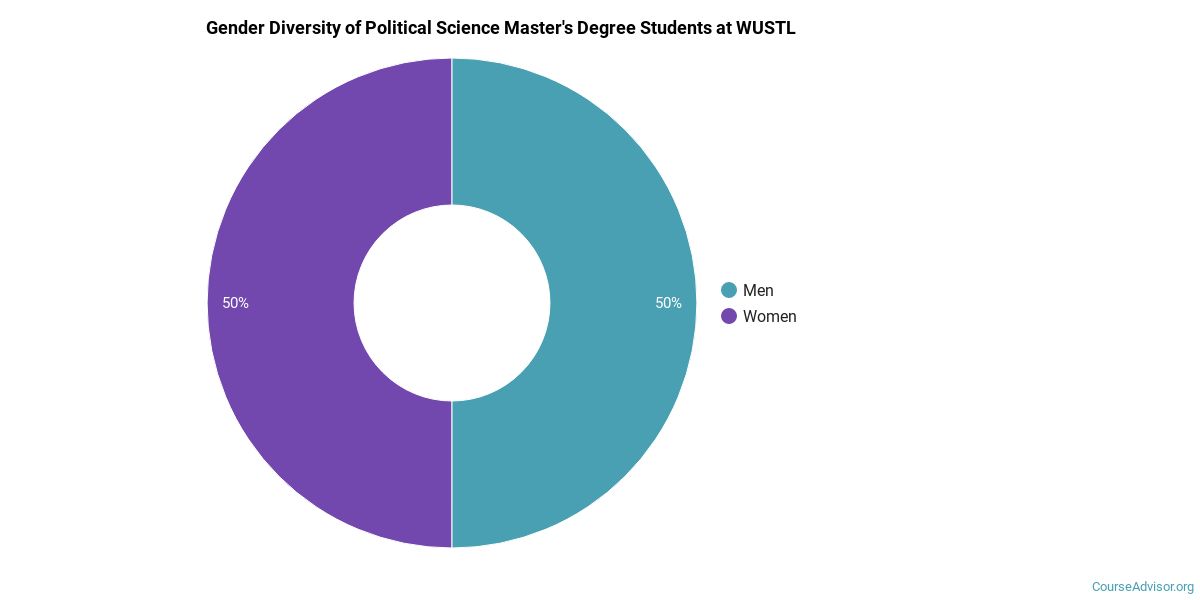
Political Science Master’s Program at Washington University in St Louis
Among the 5 master’s political science degrees awarded at Washington University in St Louis, 20% were women (1) and 80% were men (4).
The following table and chart show the race/ethnicity of Political Science master’s degree recipients at Washington University in St Louis.
| Race / Ethnicity | Number of Graduates |
|---|---|
| White | 2 |
| International (Nonresident) | 3 |

Political Science Doctoral Program at Washington University in St Louis
Of the 7 doctoral political science degrees awarded at Washington University in St Louis, 14% were women (1) and 86% were men (6).

The following table and chart show the race/ethnicity of Political Science doctoral degree recipients at Washington University in St Louis.
| Race / Ethnicity | Number of Graduates |
|---|---|
| White | 2 |
| International (Nonresident) | 4 |
| Unknown | 1 |

*The racial-ethnic minorities figure is the total number of graduates minus White, international (nonresident), and unknown-race graduates.
Highest-Paying Careers for Political Science Graduates
Graduates of the Political Science program at Washington University in St Louis pursue many career paths. The table below ranks the top-paying careers for Political Science graduates, ordered by median annual salary:
| Occupation | Nationwide Median Wage |
|---|---|
| Wind Energy Development Managers | $169,952 |
| Loss Prevention Managers | $165,723 |
| Wind Energy Operations Managers | $122,567 |
| Compliance Managers | $117,178 |
| Brownfield Redevelopment Specialists and Site Managers | $99,321 |
| Managers, All Other | $95,684 |
| Secondary School Teachers, Except Special and Career/Technical Education | $77,927 |
| Regulatory Affairs Managers | $77,828 |
| Political Scientists | $71,521 |
| Political Science Teachers, Postsecondary | $66,472 |
References
- IPEDS — Integrated Postsecondary Education Data System
- U.S. Department of Education — College Scorecard
- O*NET Online (Bureau of Labor Statistics)
- National Center for Education Statistics
More about our data sources and methodologies.
Course Advisor provides higher-education, college and university, degree, program, career, salary, and other helpful information to students, faculty, institutions, and other internet audiences. Presented information and data are subject to change. Inclusion on this website does not imply or represent a direct relationship with the company, school, or brand. Information, though believed correct at time of publication, may not be correct, and no warranty is provided. Contact the schools to verify any information before relying on it. Financial aid may be available for those who qualify. The displayed options may include sponsored or recommended results, not necessarily based on your preferences.
© Course Advisor – All Rights Reserved.