Physics at Washington State University
What traits are you looking for in a school for Physics, you may want to check out the program at Washington State University. The following information will help you decide if it is a good fit for you.
Washington State University sits in Pullman, WA.
During the most recent reporting year, 30 physics graduations were recorded at Washington State University.
Featured schools near , edit
Studying Online at Washington State University
Many students take online classes at Washington State University. Among 25,685 students, 3,979 (15%) studied exclusively online and 3,428 (13%) took at least some classes online.
Physics Rankings at Washington State University
Rankings can help you compare Washington State University’s Physics program to other colleges that offer this major.
Bachelor’s-Level Rankings
| Ranking | Scope | Rank |
|---|---|---|
| Best Value | Washington | #3 of 6 |
| Best Schools (Quality) | Washington | #5 of 6 |
| Best Schools (Quality) | Far Western (Region) | #53 of 89 |
| Best Value | Far Western (Region) | #72 of 89 |
| Best Value | Nationwide | #118 of 257 |
| Best Schools (Quality) | Nationwide | #197 of 259 |
Master’s-Level Rankings
| Ranking | Scope | Rank |
|---|---|---|
| Best Value | Washington | #3 of 6 |
| Best Schools (Quality) | Washington | #5 of 6 |
| Best Schools (Quality) | Far Western (Region) | #53 of 89 |
| Best Value | Far Western (Region) | #72 of 89 |
| Best Value | Nationwide | #118 of 257 |
| Best Schools (Quality) | Nationwide | #197 of 259 |
Doctoral-Level Rankings
| Ranking | Scope | Rank |
|---|---|---|
| Best Value | Washington | #3 of 6 |
| Best Schools (Quality) | Washington | #5 of 6 |
| Best Schools (Quality) | Far Western (Region) | #53 of 89 |
| Best Value | Far Western (Region) | #72 of 89 |
| Best Value | Nationwide | #118 of 257 |
| Best Schools (Quality) | Nationwide | #197 of 259 |
Student Demographics & Diversity
Below you’ll find the composition of Physics graduates at Washington State University, broken down by degree level.
Program-wide, Physics graduates at Washington State University are 37% women (11) and 63% men (19).
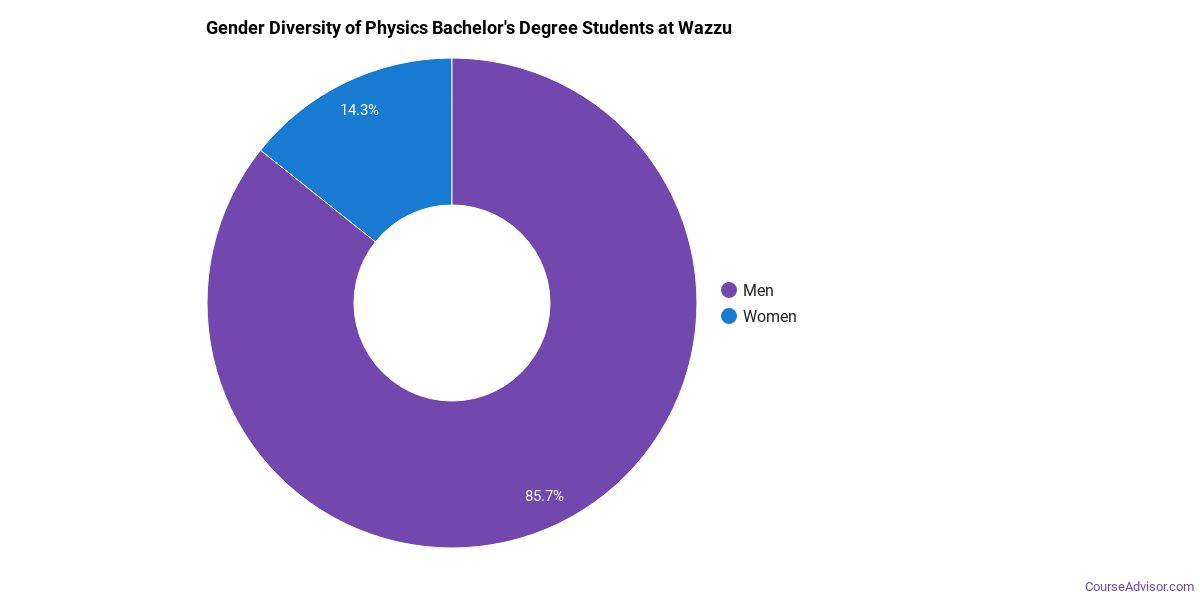
Physics Bachelor’s Program at Washington State University
Of the 17 bachelor’s physics graduates at Washington State University, 41% were women (7) and 59% were men (10).
The following table and chart show the race/ethnicity of Physics bachelor’s degree recipients at Washington State University.
| Race / Ethnicity | Number of Graduates |
|---|---|
| White | 12 |
| Hispanic / Latino | 2 |
| Black / African American | 1 |
| International (Nonresident) | 2 |
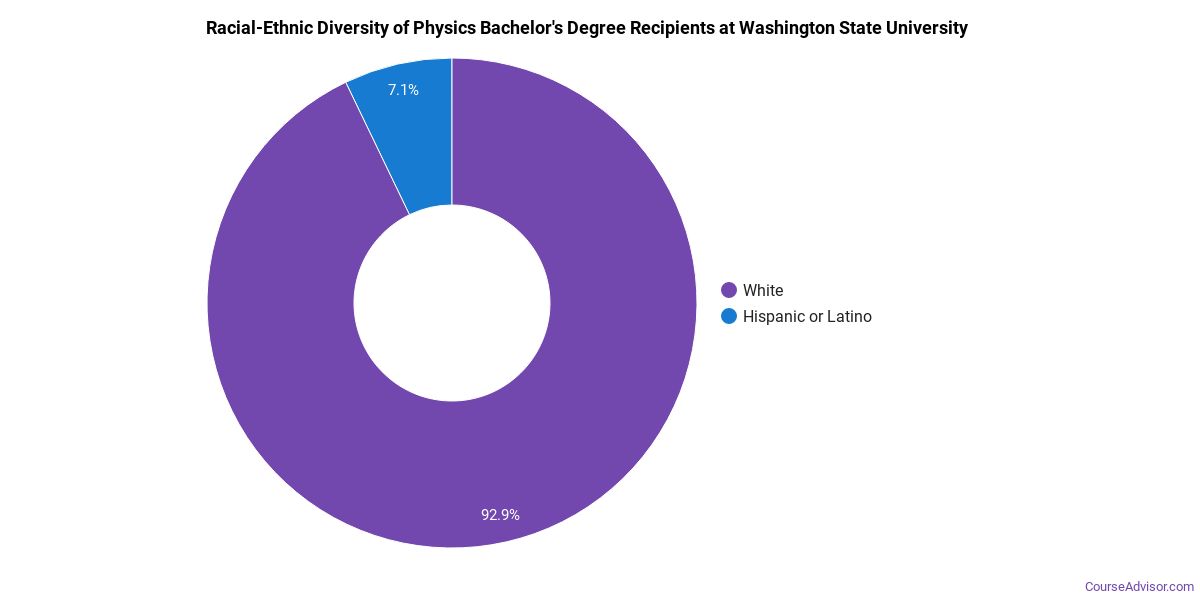
Minority students account for 18% of Physics bachelor’s degree recipients at Washington State University, lower than the national average of 30%.*
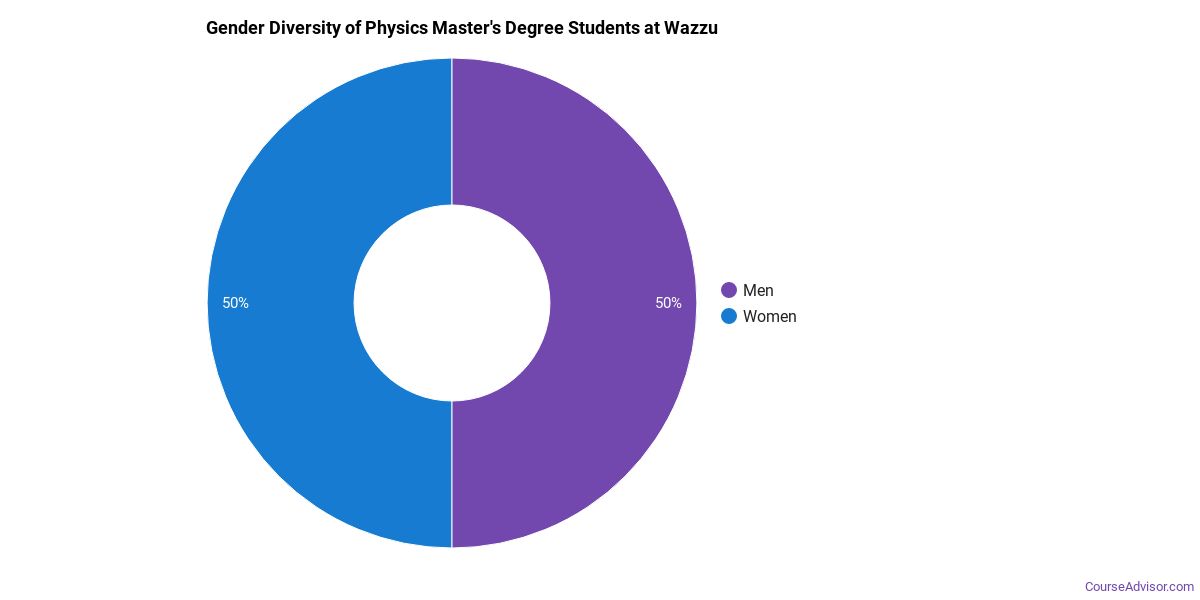
Physics Master’s Program at Washington State University
Of the 5 master’s physics graduates at Washington State University, 20% were women (1) and 80% were men (4).
The following table and chart show the race/ethnicity of Physics master’s degree recipients at Washington State University.
| Race / Ethnicity | Number of Graduates |
|---|---|
| White | 4 |
| Hispanic / Latino | 1 |
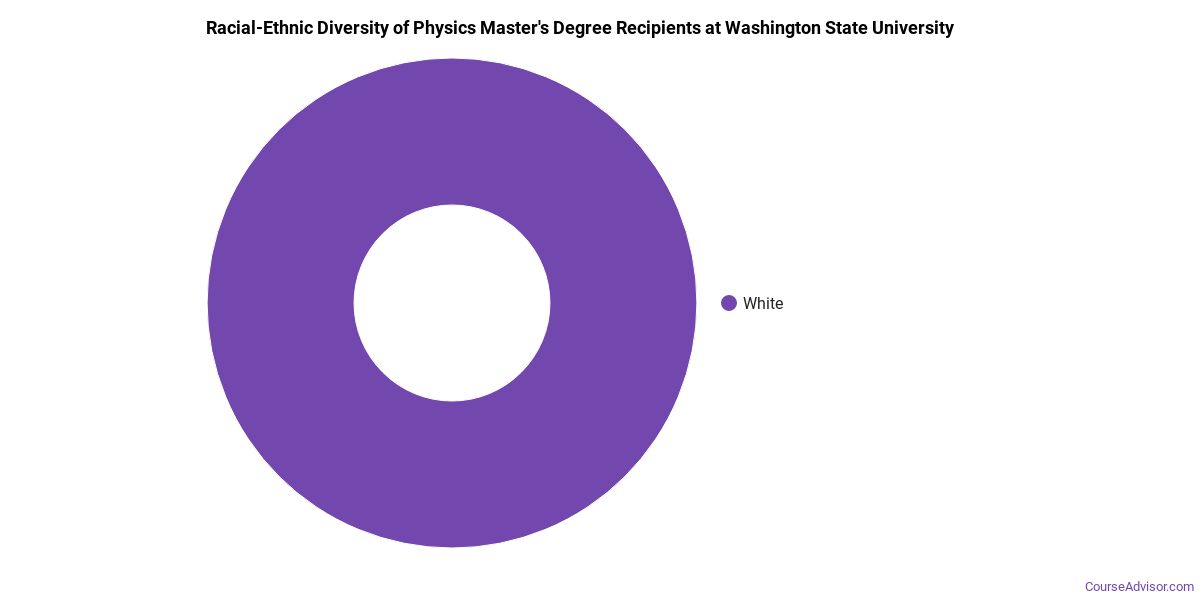
Minority students account for 20% of Physics master’s degree recipients at Washington State University, below the national average of 21%.*
Physics Doctoral Program at Washington State University
Of the 8 doctoral physics graduates at Washington State University, 38% were women (3) and 62% were men (5).

The following table and chart show the race/ethnicity of Physics doctoral degree recipients at Washington State University.
| Race / Ethnicity | Number of Graduates |
|---|---|
| White | 5 |
| International (Nonresident) | 2 |
| Unknown | 1 |

*The racial-ethnic minorities figure is the total number of graduates minus White, international (nonresident), and unknown-race graduates.
More Specific Physics Concentrations at Washington State University
The Physics program at Washington State University includes the following sub-specializations:
| Concentration | Graduates |
|---|---|
| General Physics | 30 |
Highest-Paying Careers for Physics Graduates
Graduates of the Physics program at Washington State University pursue many career paths. Below are the highest-paying careers for Physics majors, ordered by median annual salary:
| Occupation | Nationwide Median Wage |
|---|---|
| Water Resource Specialists | $179,716 |
| Natural Sciences Managers | $132,227 |
| Physicists | $111,776 |
| Clinical Research Coordinators | $110,931 |
| Physics Teachers, Postsecondary | $80,685 |
| Secondary School Teachers, Except Special and Career/Technical Education | $77,927 |
References
- IPEDS — Integrated Postsecondary Education Data System
- U.S. Department of Education — College Scorecard
- O*NET Online (Bureau of Labor Statistics)
- National Center for Education Statistics
More about our data sources and methodologies.
Course Advisor provides higher-education, college and university, degree, program, career, salary, and other helpful information to students, faculty, institutions, and other internet audiences. Presented information and data are subject to change. Inclusion on this website does not imply or represent a direct relationship with the company, school, or brand. Information, though believed correct at time of publication, may not be correct, and no warranty is provided. Contact the schools to verify any information before relying on it. Financial aid may be available for those who qualify. The displayed options may include sponsored or recommended results, not necessarily based on your preferences.
© Course Advisor – All Rights Reserved.