Wade College Overview
Located in Dallas, Texas, Wade College is a private for-profit institution. Dallas is a great location for students who prefer city over country life.
What Is Wade College Known For?
- Wade College has an impressive student to faculty ratio of 10 to 1.
- Although it may not be available for every major, the bachelor's degree is the highest award a student can attain at Wade College.
- In a recent academic period45% of the faculty were full-time.
- The average Wade College student graduates in 4.0 years. That's better than the national average of 4.4 years.
Where Is Wade College?
Contact details for Wade College are given below.
| Contact Details | |
|---|---|
| Address: | 1950 N. Stemmons Freeway, Suite 4080 Dallas Infomart, Dallas, TX 75207 |
| Phone: | 214-637-3530 |
| Website: | www.wadecollege.edu |
How Do I Get Into Wade College?
You can apply to Wade College online at: https://www.wadecollege.edu/admissions/apply_now
Can I Afford Wade College?
Student Loan Debt
It's not uncommon for college students to take out loans to pay for school. In fact, almost 66% of students nationwide depend at least partially on loans. At Wade College, approximately 73% of students took out student loans averaging $6,897 a year. That adds up to $27,588 over four years for those students.
Explore Best Ranked Schools for You
Wade College Undergraduate Student Diversity
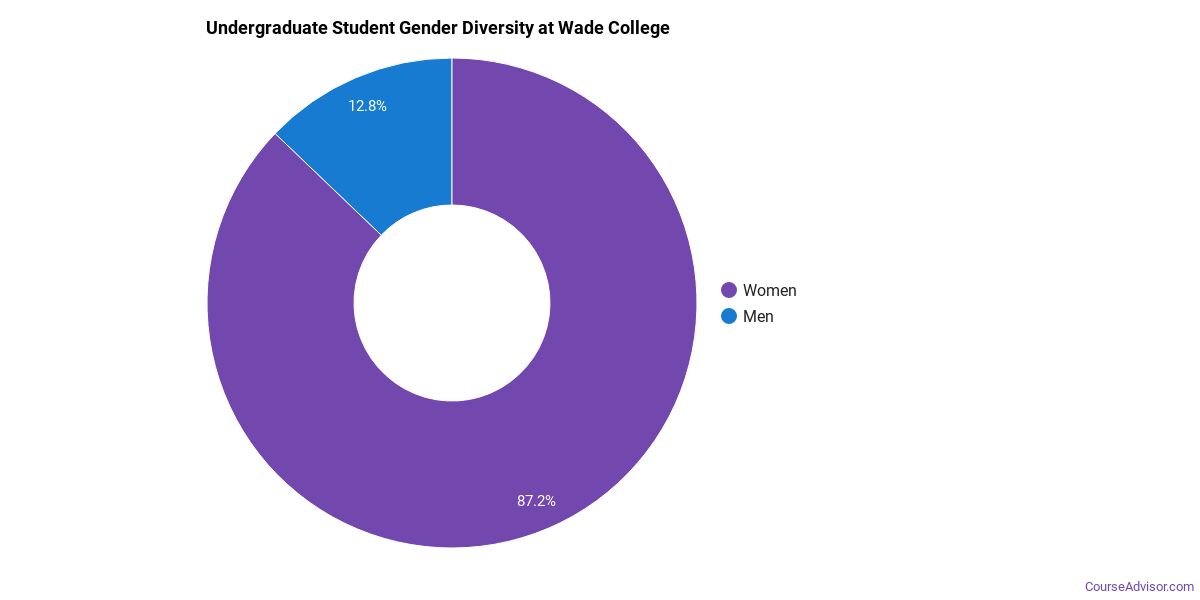
Gender Diversity
Of the 109 full-time undergraduates at Wade College, 17% are male and 83% are female.
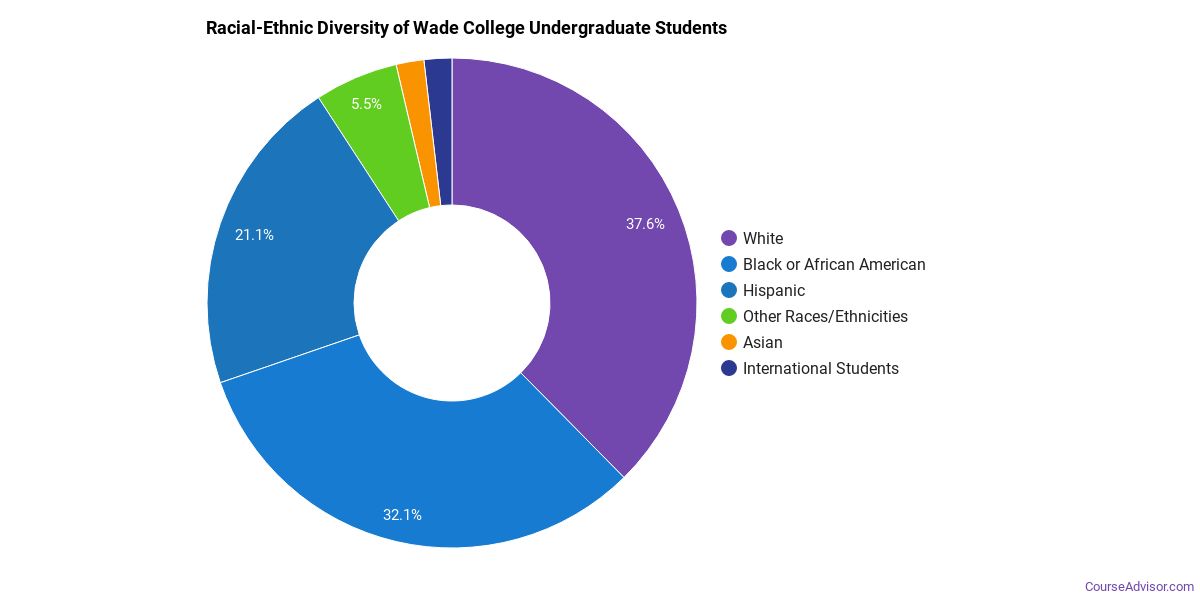
Racial-Ethnic Diversity
The racial-ethnic breakdown of Wade College students is as follows.
| Race/Ethnicity | Number of Grads |
|---|---|
| Asian | 3 |
| Black or African American | 37 |
| Hispanic or Latino | 19 |
| White | 35 |
| International Students | 0 |
| Other Races/Ethnicities | 15 |
Geographic Diversity
Texas students aren't the only ones who study at Wade College. At this time, 3 states are represented by the student population at the school.
Wade College Undergraduate Concentrations
The table below shows the number of awards for each concentration.
| Major | Associate’s | Bachelor’s | TOTAL |
|---|---|---|---|
| Design & Applied Arts | 22 | 14 | 36 |
| General Sales & Marketing | 2 | 6 | 8 |
| Computer Information Systems | 0 | 0 | 0 |
| TOTAL | 24 | 20 | 44 |
References
*The racial-ethnic minorities count is calculated by taking the total number of students and subtracting white students, international students, and students whose race/ethnicity was unknown. This number is then divided by the total number of students at the school to obtain the racial-ethnic minorities percentage.
More about our data sources and methodologies.
Course Advisor provides higher-education, college and university, degree, program, career, salary, and other helpful information to students, faculty, institutions, and other internet audiences. Presented information and data are subject to change. Inclusion on this website does not imply or represent a direct relationship with the company, school, or brand. Information, though believed correct at time of publication, may not be correct, and no warranty is provided. Contact the schools to verify any information before relying on it. Financial aid may be available for those who qualify. The displayed options may include sponsored or recommended results, not necessarily based on your preferences.
© Course Advisor – All Rights Reserved.