Ventura Adult and Continuing Education Overview
Ventura Adult and Continuing Education is a public institution situated in Ventura, California. The city atmosphere of Ventura makes it a great place for students who enjoy having lots of educational and entertainment options.
What Is Ventura Adult and Continuing Education Known For?
- Ventura Adult and Continuing Education has an impressive student to faculty ratio of 3 to 1.
- Although it may not be available for every major, the undergraduate certificate is the highest award a student can attain at Ventura Adult and Continuing Education.
Where Is Ventura Adult and Continuing Education?
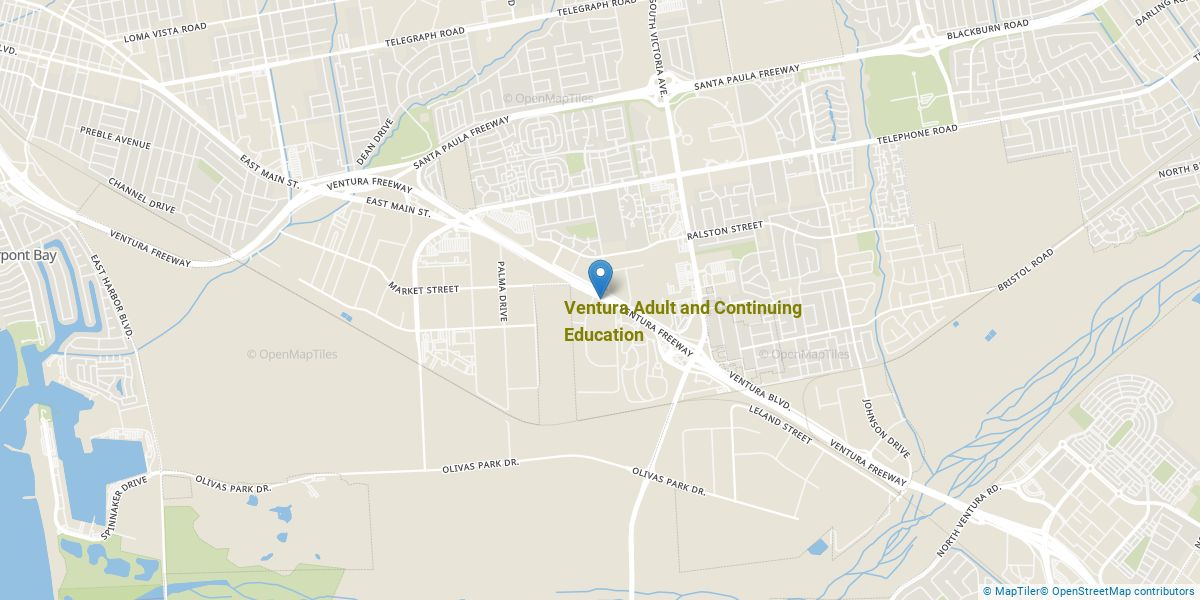
Contact details for Ventura Adult and Continuing Education are given below.
| Contact Details | |
|---|---|
| Address: | 5200 Valentine Rd, Ventura, CA 93003-0000 |
| Phone: | 805-289-1744 |
| Website: | www.adultedventura.edu |
Can I Afford Ventura Adult and Continuing Education?
Student Loan Debt
It's not uncommon for college students to take out loans to pay for school. In fact, almost 66% of students nationwide depend at least partially on loans. At Ventura Adult and Continuing Education, approximately 8% of students took out student loans averaging $5,374 a year. That adds up to $21,496 over four years for those students.
Explore Best Ranked Schools for You
Ventura Adult and Continuing Education Undergraduate Student Diversity
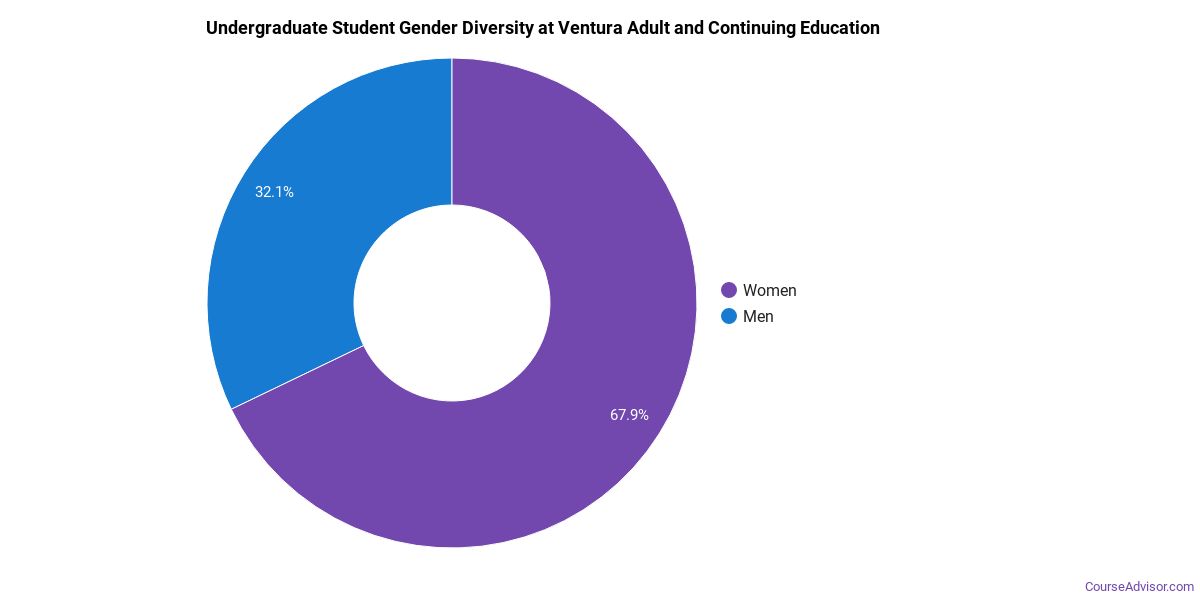
Gender Diversity
Of the 18 full-time undergraduates at Ventura Adult and Continuing Education, 17% are male and 83% are female.
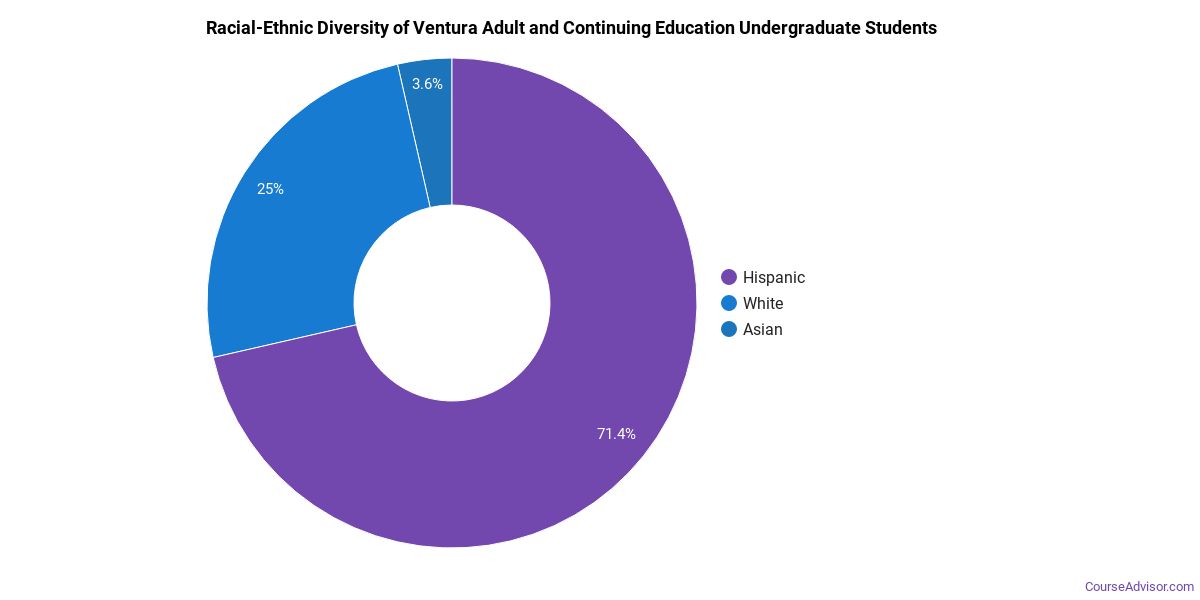
Racial-Ethnic Diversity
The racial-ethnic breakdown of Ventura Adult and Continuing Education students is as follows.
| Race/Ethnicity | Number of Grads |
|---|---|
| Asian | 0 |
| Black or African American | 0 |
| Hispanic or Latino | 10 |
| White | 7 |
| International Students | 0 |
| Other Races/Ethnicities | 1 |
Ventura Adult and Continuing Education Undergraduate Concentrations
The table below shows the number of awards for each concentration.
| Major | Basic Certificate | Undergraduate Certificate | TOTAL |
|---|---|---|---|
| Allied Health & Medical Assisting Services | 18 | 18 | 36 |
| Accounting | 4 | 12 | 16 |
| Information Technology | 0 | 13 | 13 |
| Business Administration & Management | 0 | 10 | 10 |
| Radio, Television & Digital Communication | 0 | 7 | 7 |
| Drafting & Design Engineering Technology | 0 | 7 | 7 |
| Business Support & Assistant Services | 5 | 0 | 5 |
| Graphic Communications | 0 | 3 | 3 |
| Electronics Maintenance & Repair | 0 | 0 | 0 |
| TOTAL | 27 | 70 | 97 |
References
*The racial-ethnic minorities count is calculated by taking the total number of students and subtracting white students, international students, and students whose race/ethnicity was unknown. This number is then divided by the total number of students at the school to obtain the racial-ethnic minorities percentage.
More about our data sources and methodologies.
Course Advisor provides higher-education, college and university, degree, program, career, salary, and other helpful information to students, faculty, institutions, and other internet audiences. Presented information and data are subject to change. Inclusion on this website does not imply or represent a direct relationship with the company, school, or brand. Information, though believed correct at time of publication, may not be correct, and no warranty is provided. Contact the schools to verify any information before relying on it. Financial aid may be available for those who qualify. The displayed options may include sponsored or recommended results, not necessarily based on your preferences.
© Course Advisor – All Rights Reserved.