Agriculture & Agriculture Operations at University of Washington - Seattle Campus
If you plan to study agriculture & agriculture operations, take a look at what University of Washington - Seattle Campus has to offer and decide if the program is a good match for you. Get started with the following essential facts.UW Seattle is located in Seattle, Washington and has a total student population of 48,149.
Want to know more about the career opportunities in this field? Check out the Careers in Agriculture & Agriculture Operations section at the bottom of this page.
UW Seattle Agriculture & Agriculture Operations Degrees Available
- Master’s Degree in Agriculture & Agriculture Operations
UW Seattle Agriculture & Agriculture Operations Rankings
There were 0 student who received their doctoral degrees in agriculture & agriculture operations. This is the #58 most popular school in the United States for this category of students.
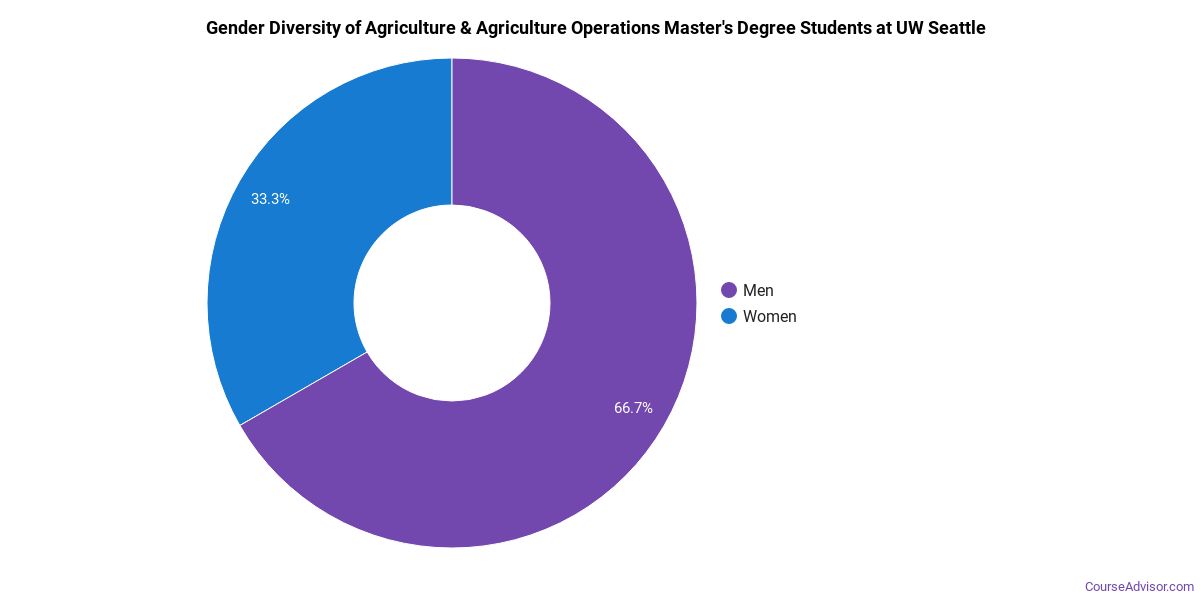
Agriculture & Agriculture Operations Student Demographics at UW Seattle
Take a look at the following statistics related to the make-up of the agriculture & agriculture operations majors at University of Washington - Seattle Campus.
UW Seattle Agriculture & Agriculture Operations Master’s Program
In the agriculture & agriculture operations master's program at this school, racial-ethnic minorities make up 50% of degree recipients. That is 23% better than the national average.*
The following table and chart show the race/ethnicity for students who recently graduated from University of Washington - Seattle Campus with a master's in agriculture & agriculture operations.
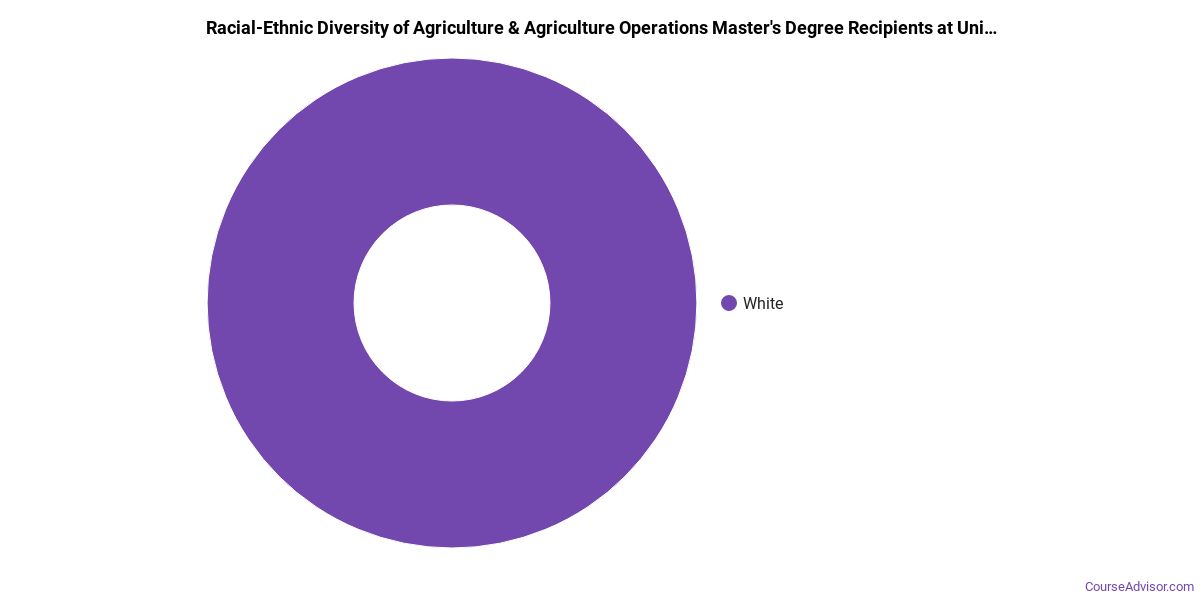
| Race/Ethnicity | Number of Students |
|---|---|
| Asian | 1 |
| Black or African American | 0 |
| Hispanic or Latino | 0 |
| White | 1 |
| International Students | 0 |
| Other Races/Ethnicities | 0 |
Concentrations Within Agriculture & Agriculture Operations
Agriculture & Agriculture Operations majors may want to concentrate their studies in one of these areas. The completion numbers here include all graduates who receive any type of degree in this field from University of Washington - Seattle Campus. Some of these focus areas may not be available for your degree level.
| Concentration | Annual Degrees Awarded |
|---|---|
| Veterinary Biomedical and Clinical Sciences | 2 |
| Plant Sciences | 1 |
Related Majors
- Science Technologies / Technicians
- Engineering Technologies
- Natural Resources & Conservation
- Architecture & Related Services
- Mathematics & Statistics
Careers That Agriculture & Agriculture Operations Grads May Go Into
A degree in agriculture & agriculture operations can lead to the following careers. Since job numbers and average salaries can vary by geographic location, we have only included the numbers for WA, the home state for University of Washington - Seattle Campus.
| Occupation | Jobs in WA | Average Salary in WA |
|---|---|---|
| Office and Administrative Support Worker Supervisors | 30,250 | $65,190 |
| Retail Sales Supervisors | 22,670 | $52,240 |
| Computer User Support Specialists | 18,630 | $62,180 |
| Aircraft Mechanics and Service Technicians | 5,320 | $68,140 |
| Graphic Designers | 5,060 | $60,530 |
References
*The racial-ethnic minorities count is calculated by taking the total number of students and subtracting white students, international students, and students whose race/ethnicity was unknown. This number is then divided by the total number of students at the school to obtain the racial-ethnic minorities percentage.
- College Factual
- National Center for Education Statistics
- O*NET Online
- Image Credit: By Joe Mabel under License
More about our data sources and methodologies.
Course Advisor provides higher-education, college and university, degree, program, career, salary, and other helpful information to students, faculty, institutions, and other internet audiences. Presented information and data are subject to change. Inclusion on this website does not imply or represent a direct relationship with the company, school, or brand. Information, though believed correct at time of publication, may not be correct, and no warranty is provided. Contact the schools to verify any information before relying on it. Financial aid may be available for those who qualify. The displayed options may include sponsored or recommended results, not necessarily based on your preferences.
© Course Advisor – All Rights Reserved.