Public Policy at University of Virginia-Main Campus
What traits are you looking for in a school for Public Policy, take a look at what University of Virginia-Main Campus. We’ve gathered the following information to help you decide.
University of Virginia-Main Campus is located in Charlottesville, VA.
During the most recent reporting year, 189 public policy graduations were recorded at University of Virginia-Main Campus.
Featured schools near , edit
Studying Online at University of Virginia-Main Campus
Distance learning is available at University of Virginia-Main Campus. Among 26,409 students, 1,962 (7%) studied exclusively online and 3,821 (14%) took at least some classes online.
Public Policy Rankings at University of Virginia-Main Campus
Rankings can help you compare University of Virginia-Main Campus’s Public Policy program against peer institutions.
Bachelor’s-Level Rankings
| Ranking | Scope | Rank |
|---|---|---|
| Best Schools (Quality) | Virginia | #1 of 6 |
| Best Schools (Quality) | Southeast (Region) | #2 of 18 |
| Best Value | Virginia | #4 of 6 |
| Best Schools (Quality) | Nationwide | #5 of 96 |
| Best Value | Southeast (Region) | #13 of 18 |
| Best Value | Nationwide | #55 of 95 |
Master’s-Level Rankings
| Ranking | Scope | Rank |
|---|---|---|
| Best Schools (Quality) | Virginia | #1 of 6 |
| Best Schools (Quality) | Southeast (Region) | #2 of 18 |
| Best Value | Virginia | #4 of 6 |
| Best Schools (Quality) | Nationwide | #5 of 96 |
| Best Value | Southeast (Region) | #13 of 18 |
| Best Value | Nationwide | #55 of 95 |
Earnings for Public Policy Graduates from University of Virginia-Main Campus
Students who complete University of Virginia-Main Campus’s Public Policy program earn at the following median levels (per the U.S. Department of Education’s College Scorecard):

| Years After Graduation | Median Earnings |
|---|---|
| 1 year | $54,807 |
| 2 years | $70,596 |
| 3 years | $84,597 |
| 4 years | $92,623 |
| 5 years | $110,885 |
How does this compare to the school overall? At the four-year mark, Public Policy graduates from University of Virginia-Main Campus report median earnings of $92,623, compared with $96,792 for all University of Virginia-Main Campus graduates — about 4% lower than the school-wide median.

Student Demographics & Diversity
Take a look at the composition of Public Policy graduates at University of Virginia-Main Campus, by degree type.
Program-wide, Public Policy graduates at University of Virginia-Main Campus are 68% women (129) and 32% men (60).
Public Policy Bachelor’s Program at University of Virginia-Main Campus
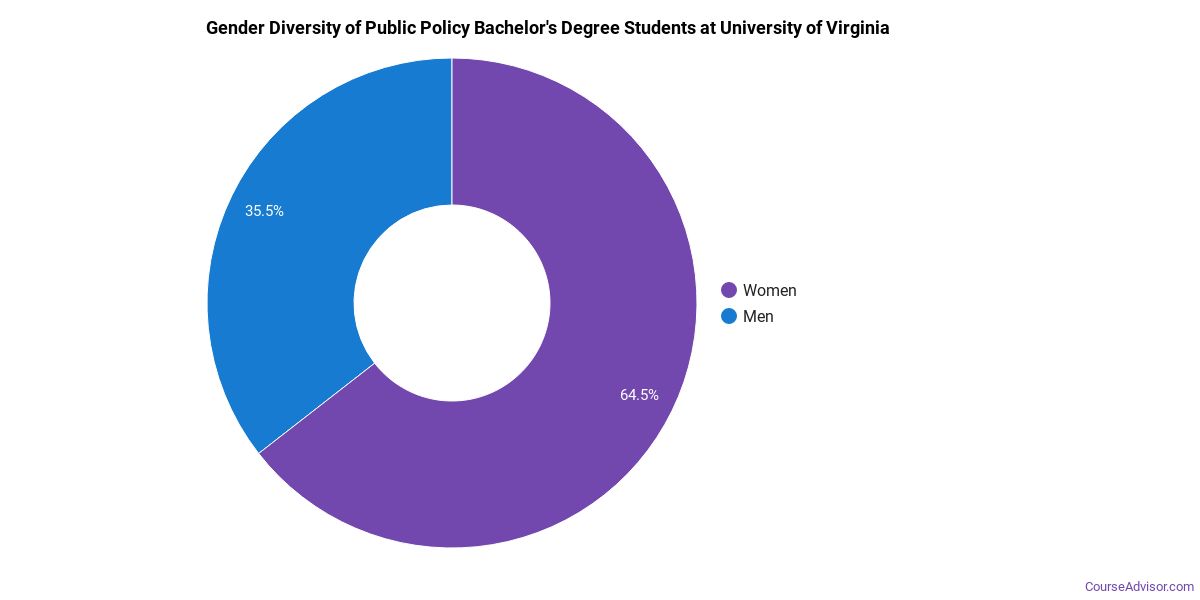
Among the 98 bachelor’s public policy degrees awarded at University of Virginia-Main Campus, 73% were women (72) and 27% were men (26).
The following table and chart show the race/ethnicity of Public Policy bachelor’s degree recipients at University of Virginia-Main Campus.
| Race / Ethnicity | Number of Graduates |
|---|---|
| White | 60 |
| Hispanic / Latino | 9 |
| Black / African American | 14 |
| Asian | 5 |
| Two or More Races | 4 |
| International (Nonresident) | 1 |
| Unknown | 5 |
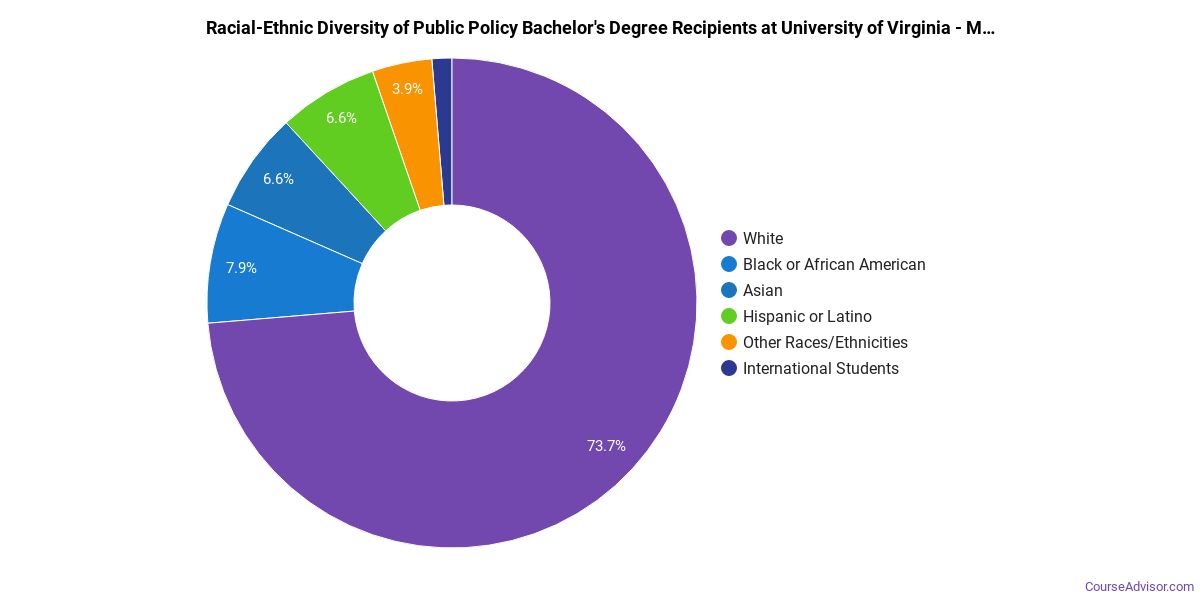
Minority students account for 33% of Public Policy bachelor’s degree recipients at University of Virginia-Main Campus, lower than the national average of 45%.*
Public Policy Master’s Program at University of Virginia-Main Campus
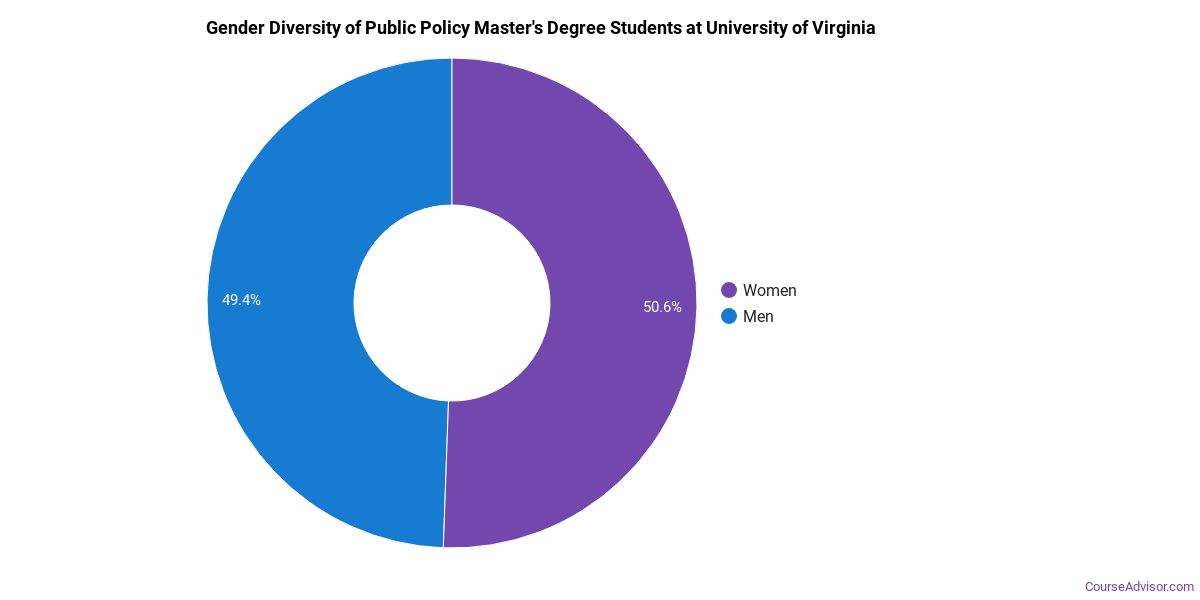
Among the 91 master’s public policy degrees awarded at University of Virginia-Main Campus, 63% were women (57) and 37% were men (34).
The following table and chart show the race/ethnicity of Public Policy master’s degree recipients at University of Virginia-Main Campus.
| Race / Ethnicity | Number of Graduates |
|---|---|
| White | 58 |
| Hispanic / Latino | 9 |
| Black / African American | 1 |
| Asian | 9 |
| Native Hawaiian / Pacific Islander | 1 |
| Two or More Races | 3 |
| International (Nonresident) | 7 |
| Unknown | 3 |
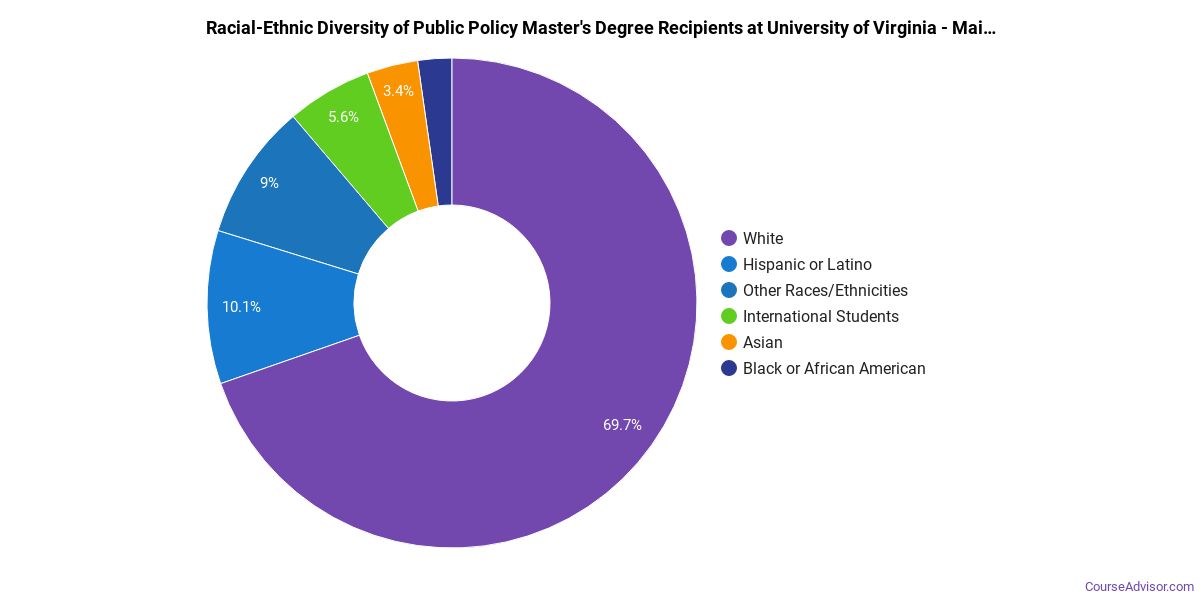
Racial-ethnic minorities make up 25% of Public Policy master’s degree recipients at University of Virginia-Main Campus, below the national average of 33%.*
*The racial-ethnic minorities figure is the total number of graduates minus White, international (nonresident), and unknown-race graduates.
More Specific Public Policy Concentrations at University of Virginia-Main Campus
The Public Policy program at University of Virginia-Main Campus offers more specialized concentrations:
| Concentration | Graduates |
|---|---|
| General Public Policy Analysis | 189 |
Highest-Paying Careers for Public Policy Graduates
Students who finish Public Policy program at University of Virginia-Main Campus work across a variety of fields. The table below ranks the highest-paying careers for Public Policy majors, ordered by median annual salary:
| Occupation | Nationwide Median Wage |
|---|---|
| Legislators | $167,600 |
| Medical and Health Services Managers | $129,557 |
| Education Teachers, Postsecondary | $98,329 |
| Political Scientists | $71,521 |
| Political Science Teachers, Postsecondary | $66,472 |
| Transportation Planners | $50,855 |
| Health Specialties Teachers, Postsecondary | $46,663 |
| Social Scientists and Related Workers, All Other | $42,168 |
| Social Science Research Assistants | $41,630 |
References
- IPEDS — Integrated Postsecondary Education Data System
- U.S. Department of Education — College Scorecard
- O*NET Online (Bureau of Labor Statistics)
- National Center for Education Statistics
More about our data sources and methodologies.
Course Advisor provides higher-education, college and university, degree, program, career, salary, and other helpful information to students, faculty, institutions, and other internet audiences. Presented information and data are subject to change. Inclusion on this website does not imply or represent a direct relationship with the company, school, or brand. Information, though believed correct at time of publication, may not be correct, and no warranty is provided. Contact the schools to verify any information before relying on it. Financial aid may be available for those who qualify. The displayed options may include sponsored or recommended results, not necessarily based on your preferences.
© Course Advisor – All Rights Reserved.