Special Education at University of Vermont
If you plan to study Special Education, consider the program at University of Vermont. Get started with the following essential facts.
University of Vermont is located in Burlington, VT.
During the most recent reporting year, 26 special education degrees were granted at University of Vermont.
Featured schools near , edit
Studying Online at University of Vermont
Many students take online classes at University of Vermont. Of 14,476 students, 456 (3%) studied exclusively online and 3,228 (22%) took at least some classes online.
Special Education Rankings at University of Vermont
Rankings can help you compare University of Vermont’s Special Education program against other schools offering the same major.
Bachelor’s-Level Rankings
| Ranking | Scope | Rank |
|---|---|---|
| Best Schools (Quality) | Vermont | #1 of 1 |
| Best Value | Vermont | #1 of 1 |
| Best Value | New England (Region) | #15 of 33 |
| Best Schools (Quality) | New England (Region) | #16 of 34 |
| Best Schools (Quality) | Nationwide | #166 of 491 |
| Best Value | Nationwide | #345 of 486 |
Master’s-Level Rankings
| Ranking | Scope | Rank |
|---|---|---|
| Best Schools (Quality) | Vermont | #1 of 1 |
| Best Value | Vermont | #1 of 1 |
| Best Value | New England (Region) | #15 of 33 |
| Best Schools (Quality) | New England (Region) | #16 of 34 |
| Best Schools (Quality) | Nationwide | #166 of 491 |
| Best Value | Nationwide | #345 of 486 |
Earnings for Special Education Graduates from University of Vermont
Graduates of University of Vermont’s Special Education program earn the following amounts (per the U.S. Department of Education’s College Scorecard):

| Years After Graduation | Median Earnings |
|---|---|
| 1 year | $48,618 |
| 2 years | $51,482 |
Student Demographics & Diversity
Take a look at the diversity of Special Education graduates at University of Vermont, by degree type.
Looking at the program as a whole, Special Education graduates at University of Vermont are 92% women (24) and 8% men (2).
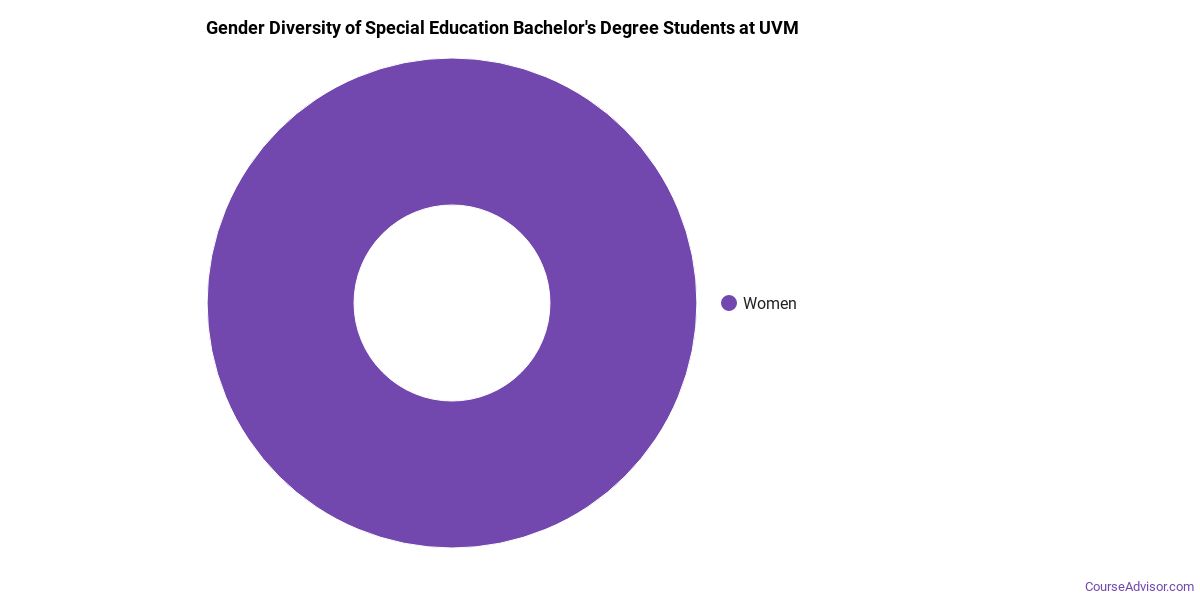
Special Education Bachelor’s Program at University of Vermont
Of the 6 bachelor’s special education graduates at University of Vermont, 100% were women (6) and 0% were men (0).
The following table and chart show the race/ethnicity of Special Education bachelor’s degree recipients at University of Vermont.
| Race / Ethnicity | Number of Graduates |
|---|---|
| White | 4 |
| Hispanic / Latino | 1 |
| Asian | 1 |
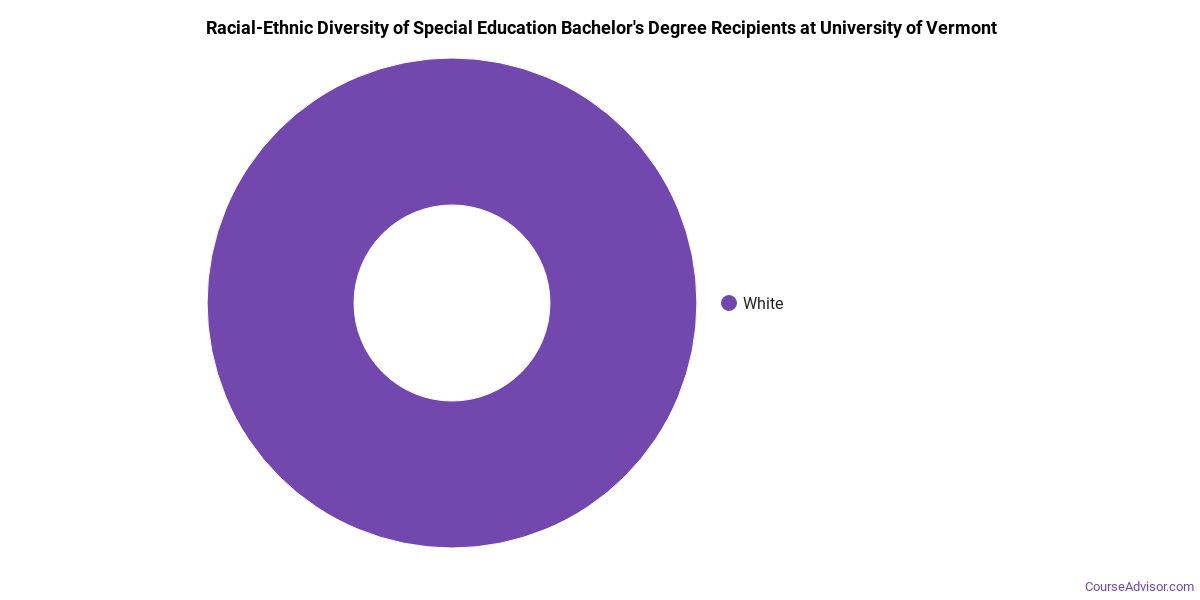
Racial-ethnic minorities make up 33% of Special Education bachelor’s degree recipients at University of Vermont, above the national average of 20%.*
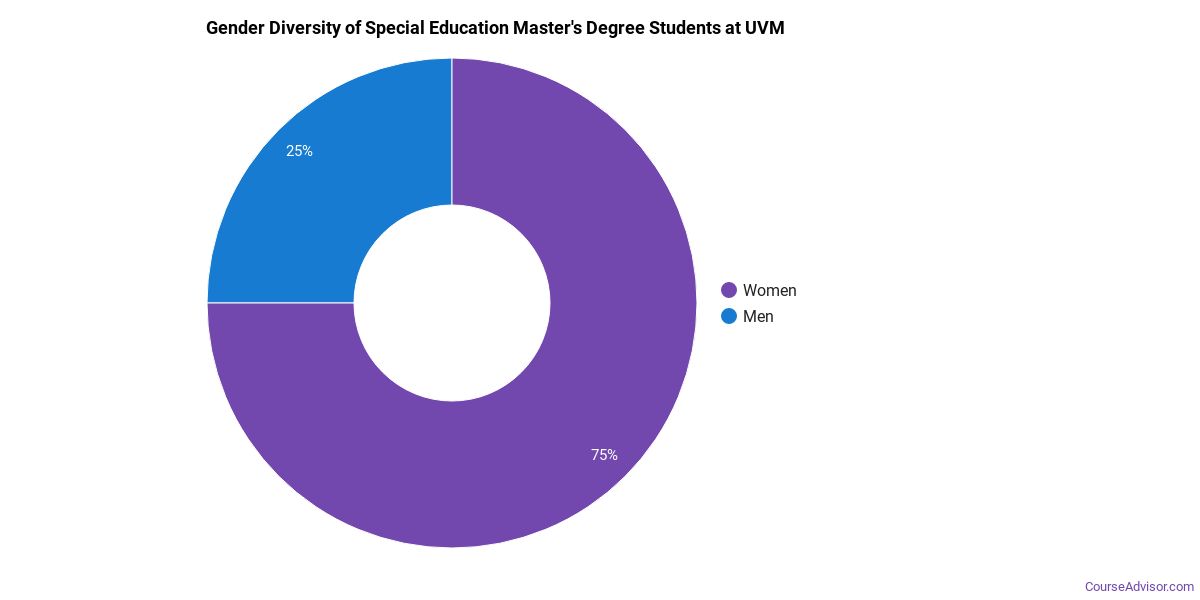
Special Education Master’s Program at University of Vermont
Among the 20 master’s special education degrees awarded at University of Vermont, 90% were women (18) and 10% were men (2).
The following table and chart show the race/ethnicity of Special Education master’s degree recipients at University of Vermont.
| Race / Ethnicity | Number of Graduates |
|---|---|
| White | 15 |
| Hispanic / Latino | 2 |
| Two or More Races | 2 |
| International (Nonresident) | 1 |
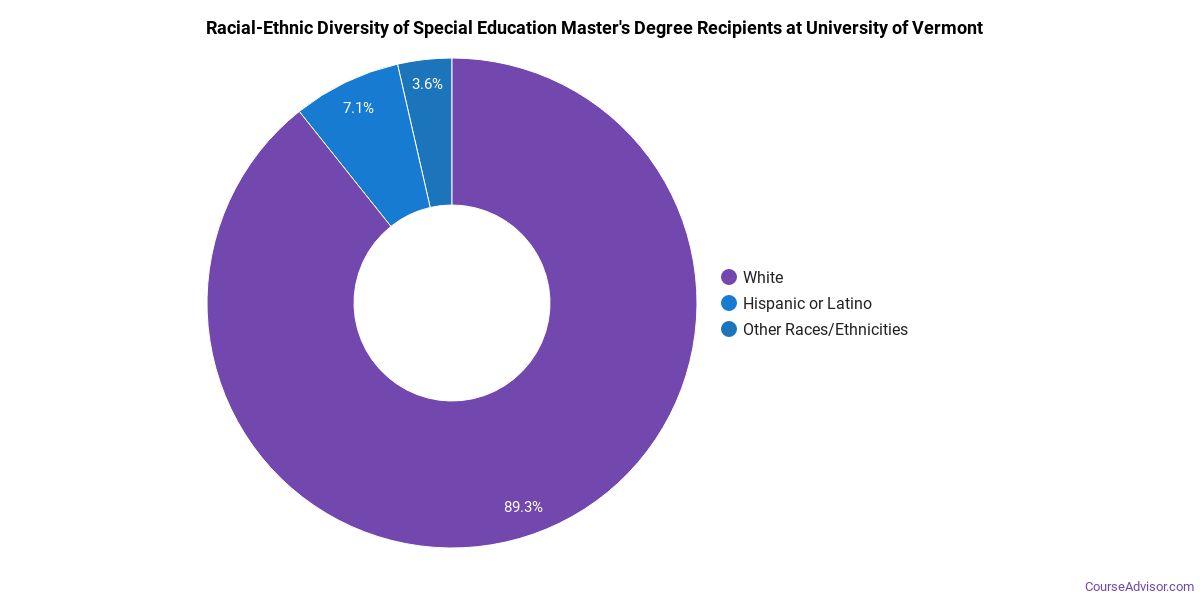
Minority students account for 20% of Special Education master’s degree recipients at University of Vermont, below the national average of 33%.*
*The racial-ethnic minorities figure is the total number of graduates minus White, international (nonresident), and unknown-race graduates.
More Specific Special Education Concentrations at University of Vermont
This Special Education program at University of Vermont includes the following sub-specializations:
| Concentration | Graduates |
|---|---|
| General Special Education | 20 |
| Early Childhood Special Education | 6 |
Top-Paying Careers for Special Education Graduates
Students who finish Special Education program at University of Vermont go on to a range of careers. The table below ranks the best-paid careers for Special Education majors, ordered by median annual salary:
| Occupation | Nationwide Median Wage |
|---|---|
| Education Teachers, Postsecondary | $98,329 |
| Teaching Assistants, Special Education | $96,801 |
| Special Education Teachers, All Other | $86,208 |
| Special Education Teachers, Middle School | $80,694 |
| Special Education Teachers, Secondary School | $79,680 |
| Adapted Physical Education Specialists | $77,976 |
| Special Education Teachers, Kindergarten | $73,597 |
| Interpreters and Translators | $52,627 |
| Special Education Teachers, Elementary School | $50,045 |
| Special Education Teachers, Preschool | $35,173 |
References
- IPEDS — Integrated Postsecondary Education Data System
- U.S. Department of Education — College Scorecard
- O*NET Online (Bureau of Labor Statistics)
- National Center for Education Statistics
More about our data sources and methodologies.
Course Advisor provides higher-education, college and university, degree, program, career, salary, and other helpful information to students, faculty, institutions, and other internet audiences. Presented information and data are subject to change. Inclusion on this website does not imply or represent a direct relationship with the company, school, or brand. Information, though believed correct at time of publication, may not be correct, and no warranty is provided. Contact the schools to verify any information before relying on it. Financial aid may be available for those who qualify. The displayed options may include sponsored or recommended results, not necessarily based on your preferences.
© Course Advisor – All Rights Reserved.