Ethnic Studies at University of Utah
If you are interested in studying Ethnic Studies, you may want to check out the program at University of Utah. Get started with the following essential facts.
University of Utah sits in Salt Lake City, UT.
For the most recent IPEDS reporting year, 51 ethnic studies graduations were recorded at University of Utah.
Featured schools near , edit
Online & Distance Learning at University of Utah
Distance learning is available at University of Utah. Among 36,894 students, 2,249 (6%) studied exclusively online and 15,066 (41%) took at least some classes online.
Ethnic Studies Rankings at University of Utah
Use these rankings to compare University of Utah’s Ethnic Studies program against other schools offering the same major.
Bachelor’s-Level Rankings
| Ranking | Scope | Rank |
|---|---|---|
| Best Schools (Quality) | Rocky Mountains (Region) | #1 of 4 |
| Best Schools (Quality) | Utah | #1 of 1 |
| Best Value | Rocky Mountains (Region) | #1 of 4 |
| Best Value | Utah | #1 of 1 |
| Best Schools (Quality) | Nationwide | #12 of 143 |
| Best Value | Nationwide | #36 of 142 |
Earnings for Ethnic Studies Graduates from University of Utah
Those who finish University of Utah’s Ethnic Studies program earn the following amounts (per the U.S. Department of Education’s College Scorecard):
| Years After Graduation | Median Earnings |
|---|---|
| 1 year | $34,734 |
Student Demographics & Diversity
Below you’ll find the student demographics for Ethnic Studies graduates at University of Utah, broken down by degree level.
Program-wide, Ethnic Studies graduates at University of Utah are 73% women (37) and 27% men (14).
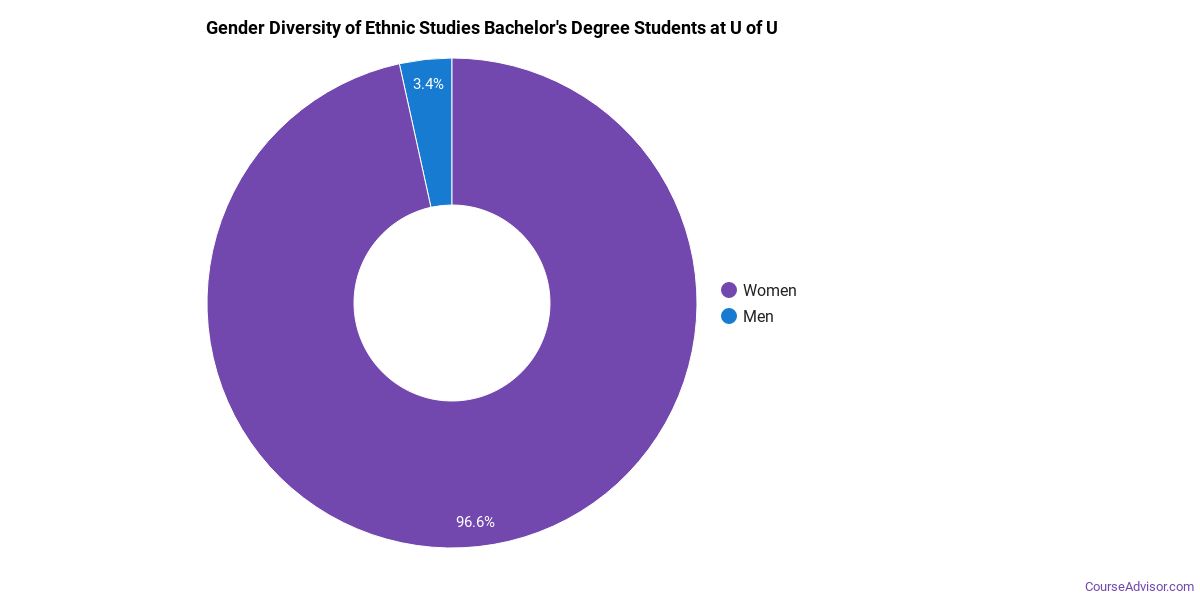
Ethnic Studies Bachelor’s Program at University of Utah
Among the 44 bachelor’s ethnic studies degrees awarded at University of Utah, 73% were women (32) and 27% were men (12).
The following table and chart show the race/ethnicity of Ethnic Studies bachelor’s degree recipients at University of Utah.
| Race / Ethnicity | Number of Graduates |
|---|---|
| White | 24 |
| Hispanic / Latino | 12 |
| Black / African American | 1 |
| Asian | 3 |
| American Indian / Alaska Native | 1 |
| Native Hawaiian / Pacific Islander | 1 |
| International (Nonresident) | 2 |
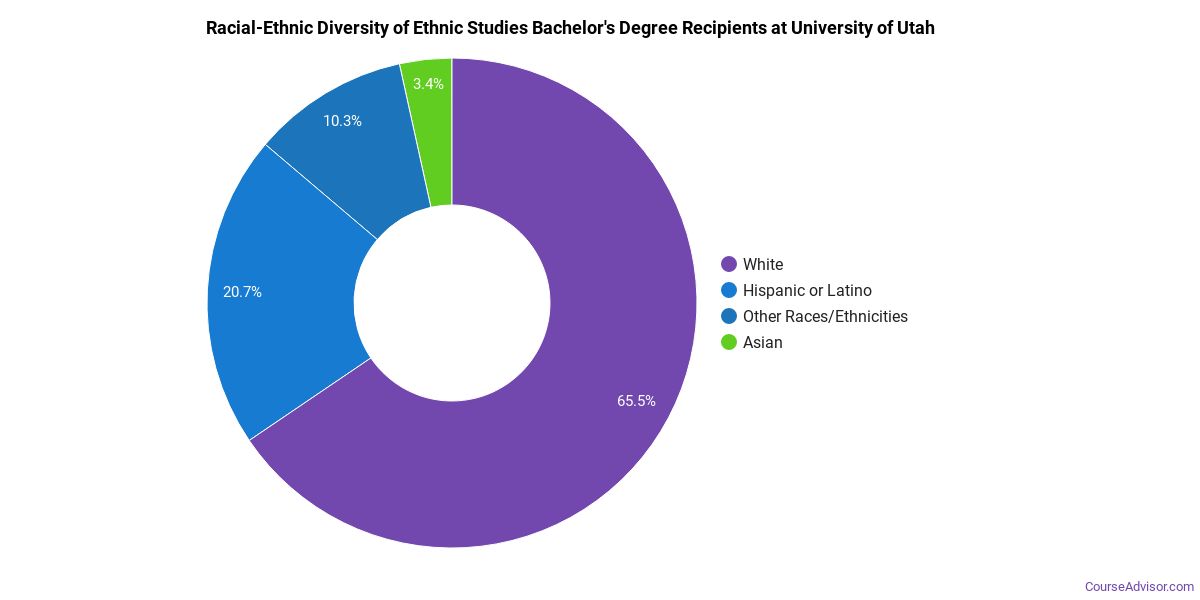
Racial-ethnic minorities make up 41% of Ethnic Studies bachelor’s degree recipients at University of Utah, lower than the national average of 66%.*
*The racial-ethnic minorities figure is the total number of graduates minus White, international (nonresident), and unknown-race graduates.
More Specific Ethnic Studies Concentrations at University of Utah
This Ethnic Studies program at University of Utah breaks down into more specific concentrations:
| Concentration | Graduates |
|---|---|
| Women’s Studies | 38 |
| Other Ethnic Studies | 13 |
Highest-Paying Careers for Ethnic Studies Graduates
Graduates of the Ethnic Studies program at University of Utah go on to a range of careers. Below are the top-paying careers for Ethnic Studies majors, ordered by median annual salary:
| Occupation | Nationwide Median Wage |
|---|---|
| Interpreters and Translators | $52,627 |
| Area, Ethnic, and Cultural Studies Teachers, Postsecondary | $47,517 |
References
- IPEDS — Integrated Postsecondary Education Data System
- U.S. Department of Education — College Scorecard
- O*NET Online (Bureau of Labor Statistics)
- National Center for Education Statistics
More about our data sources and methodologies.
Course Advisor provides higher-education, college and university, degree, program, career, salary, and other helpful information to students, faculty, institutions, and other internet audiences. Presented information and data are subject to change. Inclusion on this website does not imply or represent a direct relationship with the company, school, or brand. Information, though believed correct at time of publication, may not be correct, and no warranty is provided. Contact the schools to verify any information before relying on it. Financial aid may be available for those who qualify. The displayed options may include sponsored or recommended results, not necessarily based on your preferences.
© Course Advisor – All Rights Reserved.