University of Puerto Rico - Arecibo Overview
University of Puerto Rico - Arecibo is a public institution situated in Arecibo, Puerto Rico. The location of UPR Arecibo is great for students who prefer living in an urban area.
What Is University of Puerto Rico - Arecibo Known For?
- Although it may not be available for every major, the master's degree is the highest award a student can attain at UPR Arecibo.
- During a recent academic cycle, 76% of the faculty were full-time.
Where Is University of Puerto Rico - Arecibo?

Contact details for UPR Arecibo are given below.
| Contact Details | |
|---|---|
| Address: | Finca Las Dunas Carr 653 Ruta 129 Km 8, Arecibo, PR 00614-4010 |
| Phone: | 787-815-0000 |
| Website: | www.upra.edu |
How Do I Get Into UPR Arecibo?
You can apply to UPR Arecibo online at: https://solicitud.upr.edu/
Admission Requirements for UPR Arecibo
| Submission | Required? |
|---|---|
| High School GPA | 1 |
| High School Rank | 3 |
| High School Transcript | 1 |
| College Prep Program | 5 |
| Recommendations | 3 |
| SAT or ACT Scores | 3 |
| TOEFL | 3 |
How Hard Is It To Get Into UPR Arecibo?
Approximately 39% of accepted students are men and 61% are women. The acceptance rate for men is 59%, and the acceptance rate for women is 61%.
Can I Afford University of Puerto Rico - Arecibo?
Explore Best Ranked Schools for You
University of Puerto Rico - Arecibo Undergraduate Student Diversity
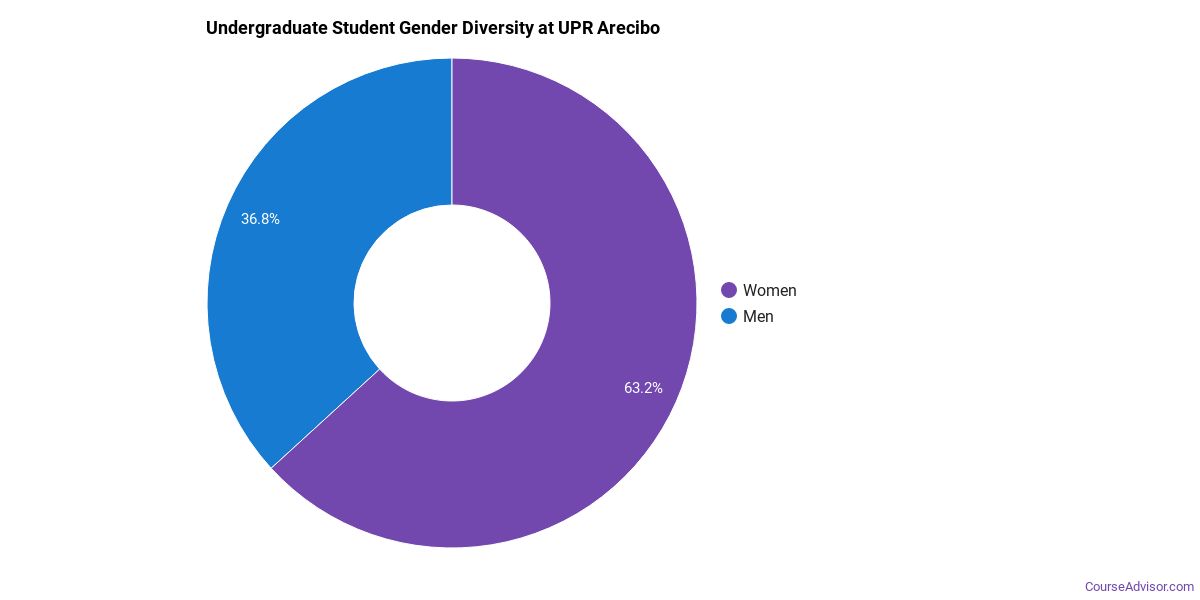
Gender Diversity
Of the 3,197 full-time undergraduates at UPR Arecibo, 38% are male and 62% are female.
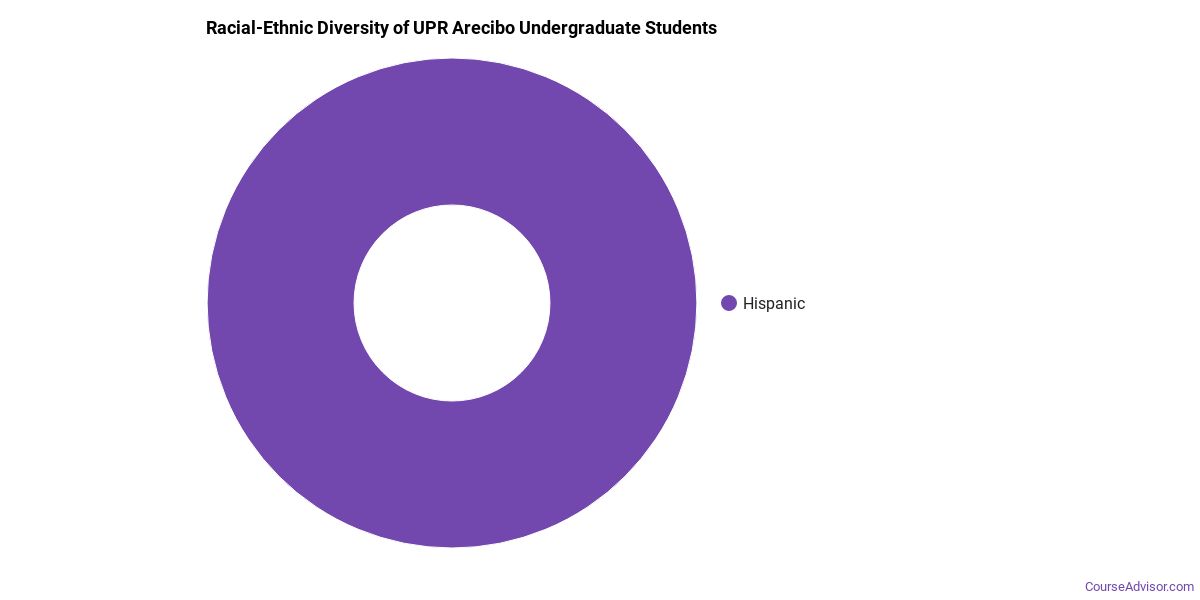
Racial-Ethnic Diversity
The racial-ethnic breakdown of University of Puerto Rico - Arecibo students is as follows.
| Race/Ethnicity | Number of Grads |
|---|---|
| Asian | 0 |
| Black or African American | 0 |
| Hispanic or Latino | 3,197 |
| White | 0 |
| International Students | 0 |
| Other Races/Ethnicities | 0 |
University of Puerto Rico - Arecibo Undergraduate Concentrations
The table below shows the number of awards for each concentration.
| Major | Associate’s | Bachelor’s | TOTAL |
|---|---|---|---|
| Microbiological Sciences & Immunology | 0 | 116 | 116 |
| Nursing | 25 | 91 | 116 |
| Industrial Production Technology | 7 | 63 | 70 |
| Audiovisual Communications | 0 | 62 | 62 |
| Business Administration & Management | 0 | 35 | 35 |
| Veterinary/Animal Health Technologies/Technicians | 34 | 0 | 34 |
| Clinical, Counseling & Applied Psychology | 0 | 34 | 34 |
| Accounting | 0 | 22 | 22 |
| Marketing | 0 | 18 | 18 |
| Computer Science | 0 | 14 | 14 |
| Teacher Education Subject Specific | 0 | 10 | 10 |
| Other Social Sciences | 0 | 9 | 9 |
| Teacher Education Grade Specific | 0 | 8 | 8 |
| Finance & Financial Management | 0 | 5 | 5 |
| Other Psychology | 0 | 0 | 0 |
| TOTAL | 66 | 487 | 553 |
References
*The racial-ethnic minorities count is calculated by taking the total number of students and subtracting white students, international students, and students whose race/ethnicity was unknown. This number is then divided by the total number of students at the school to obtain the racial-ethnic minorities percentage.
More about our data sources and methodologies.
Course Advisor provides higher-education, college and university, degree, program, career, salary, and other helpful information to students, faculty, institutions, and other internet audiences. Presented information and data are subject to change. Inclusion on this website does not imply or represent a direct relationship with the company, school, or brand. Information, though believed correct at time of publication, may not be correct, and no warranty is provided. Contact the schools to verify any information before relying on it. Financial aid may be available for those who qualify. The displayed options may include sponsored or recommended results, not necessarily based on your preferences.
© Course Advisor – All Rights Reserved.