Physics at University of Pittsburgh-Pittsburgh Campus
If you are interested in studying Physics, you may want to check out the program at University of Pittsburgh-Pittsburgh Campus. Get started with the following essential facts.
University of Pittsburgh-Pittsburgh Campus is located in Pittsburgh, PA.
In the most recent year for which we have data, 44 physics degrees were awarded at University of Pittsburgh-Pittsburgh Campus.
Featured schools near , edit
Online & Distance Learning at University of Pittsburgh-Pittsburgh Campus
Distance learning is available at University of Pittsburgh-Pittsburgh Campus. Among 35,724 students, 1,465 (4%) studied exclusively online and 6,044 (17%) took at least some classes online.
Physics Rankings at University of Pittsburgh-Pittsburgh Campus
Rankings can help you compare University of Pittsburgh-Pittsburgh Campus’s Physics program to other colleges that offer this major.
Bachelor’s-Level Rankings
| Ranking | Scope | Rank |
|---|---|---|
| Best Schools (Quality) | Pennsylvania | #3 of 9 |
| Best Value | Pennsylvania | #4 of 9 |
| Best Schools (Quality) | Middle Atlantic (Region) | #10 of 36 |
| Best Value | Middle Atlantic (Region) | #22 of 35 |
| Best Schools (Quality) | Nationwide | #44 of 259 |
| Best Value | Nationwide | #228 of 257 |
Master’s-Level Rankings
| Ranking | Scope | Rank |
|---|---|---|
| Best Schools (Quality) | Pennsylvania | #3 of 9 |
| Best Value | Pennsylvania | #4 of 9 |
| Best Schools (Quality) | Middle Atlantic (Region) | #10 of 36 |
| Best Value | Middle Atlantic (Region) | #22 of 35 |
| Best Schools (Quality) | Nationwide | #44 of 259 |
| Best Value | Nationwide | #228 of 257 |
Doctoral-Level Rankings
| Ranking | Scope | Rank |
|---|---|---|
| Best Schools (Quality) | Pennsylvania | #3 of 9 |
| Best Value | Pennsylvania | #4 of 9 |
| Best Schools (Quality) | Middle Atlantic (Region) | #10 of 36 |
| Best Value | Middle Atlantic (Region) | #22 of 35 |
| Best Schools (Quality) | Nationwide | #44 of 259 |
| Best Value | Nationwide | #228 of 257 |
Student Demographics & Diversity
The following sections describe the diversity of Physics graduates at University of Pittsburgh-Pittsburgh Campus, broken down by degree level.
Looking at the program as a whole, Physics graduates at University of Pittsburgh-Pittsburgh Campus are 25% women (11) and 75% men (33).
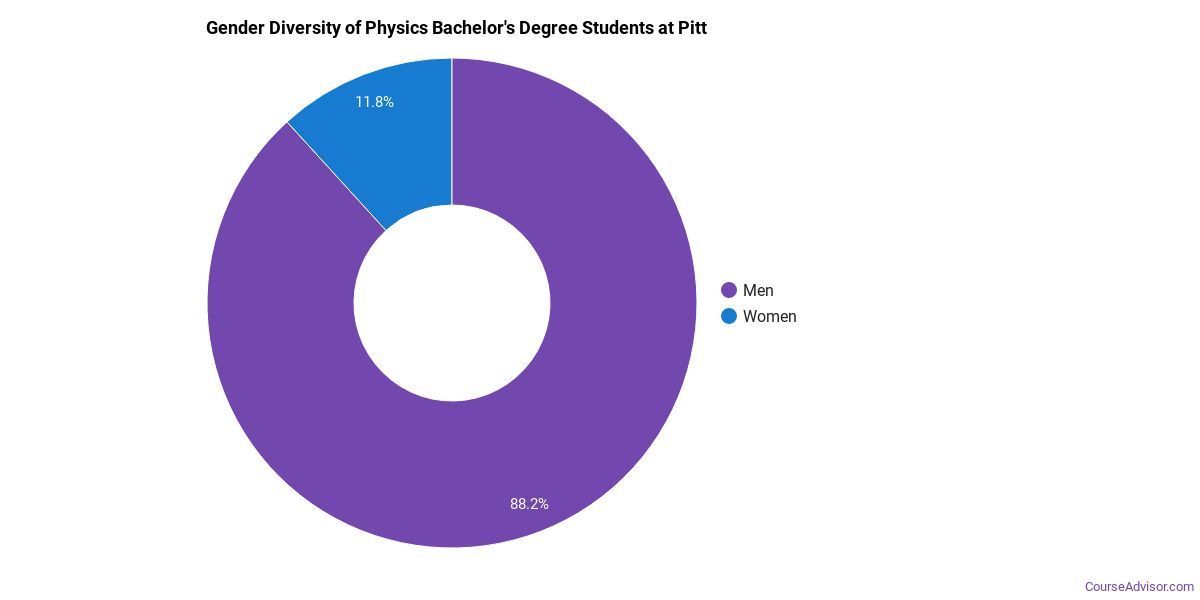
Physics Bachelor’s Program at University of Pittsburgh-Pittsburgh Campus
Of the 7 bachelor’s physics graduates at University of Pittsburgh-Pittsburgh Campus, 0% were women (0) and 100% were men (7).
The following table and chart show the race/ethnicity of Physics bachelor’s degree recipients at University of Pittsburgh-Pittsburgh Campus.
| Race / Ethnicity | Number of Graduates |
|---|---|
| White | 5 |
| Hispanic / Latino | 1 |
| Asian | 1 |
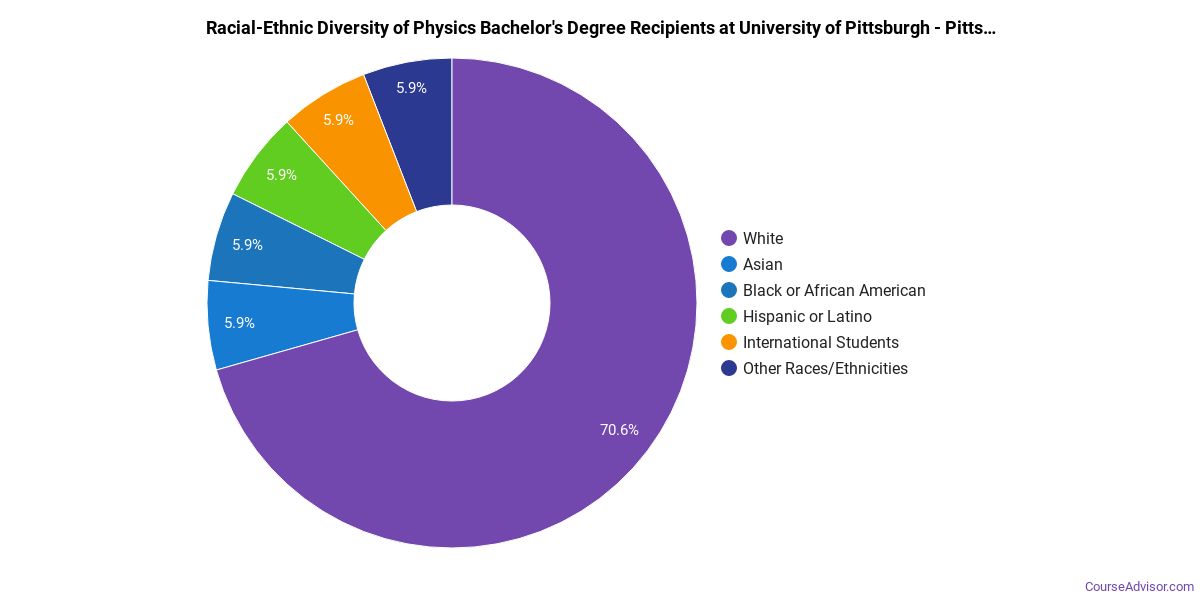
Racial-ethnic minorities make up 29% of Physics bachelor’s degree recipients at University of Pittsburgh-Pittsburgh Campus, below the national average of 30%.*
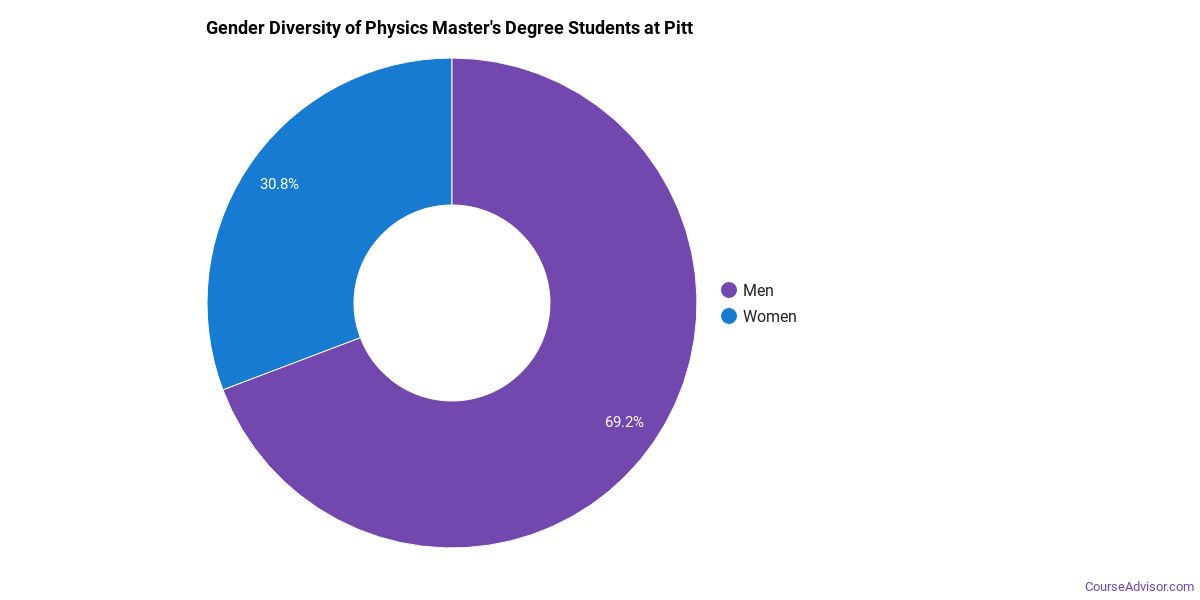
Physics Master’s Program at University of Pittsburgh-Pittsburgh Campus
Among the 12 master’s physics degrees awarded at University of Pittsburgh-Pittsburgh Campus, 33% were women (4) and 67% were men (8).
The following table and chart show the race/ethnicity of Physics master’s degree recipients at University of Pittsburgh-Pittsburgh Campus.
| Race / Ethnicity | Number of Graduates |
|---|---|
| White | 3 |
| Hispanic / Latino | 1 |
| International (Nonresident) | 7 |
| Unknown | 1 |
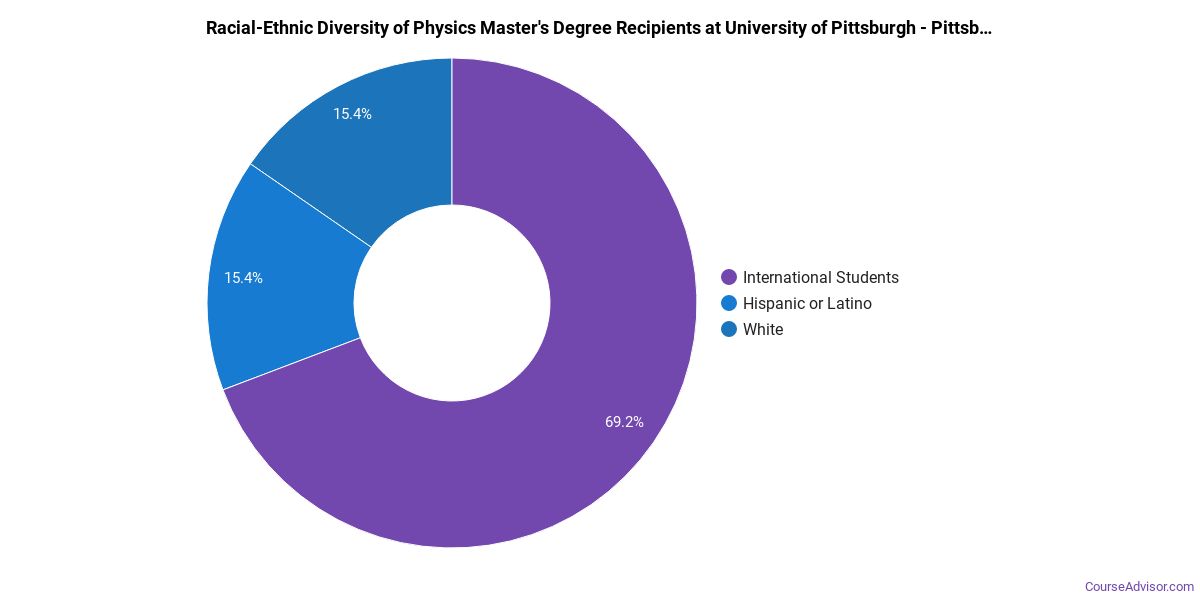
Minority students account for 8% of Physics master’s degree recipients at University of Pittsburgh-Pittsburgh Campus, lower than the national average of 21%.*
Physics Doctoral Program at University of Pittsburgh-Pittsburgh Campus
Of the 17 doctoral physics degrees awarded at University of Pittsburgh-Pittsburgh Campus, 29% were women (5) and 71% were men (12).

The following table and chart show the race/ethnicity of Physics doctoral degree recipients at University of Pittsburgh-Pittsburgh Campus.
| Race / Ethnicity | Number of Graduates |
|---|---|
| White | 6 |
| Asian | 1 |
| International (Nonresident) | 10 |

Racial-ethnic minorities make up 6% of Physics doctoral degree recipients at University of Pittsburgh-Pittsburgh Campus, lower than the national average of 14%.*
*The racial-ethnic minorities figure is the total number of graduates minus White, international (nonresident), and unknown-race graduates.
More Specific Physics Concentrations at University of Pittsburgh-Pittsburgh Campus
This Physics program at University of Pittsburgh-Pittsburgh Campus includes the following sub-specializations:
| Concentration | Graduates |
|---|---|
| General Physics | 36 |
| Optics/Optical Sciences | 1 |
| Theoretical & Mathematical Physics | 7 |
Top-Paying Careers for Physics Graduates
Students who finish Physics program at University of Pittsburgh-Pittsburgh Campus work across a variety of fields. Here are the highest-paying careers for Physics majors, ordered by median annual salary:
| Occupation | Nationwide Median Wage |
|---|---|
| Water Resource Specialists | $179,716 |
| Natural Sciences Managers | $132,227 |
| Physicists | $111,776 |
| Clinical Research Coordinators | $110,931 |
| Physics Teachers, Postsecondary | $80,685 |
| Secondary School Teachers, Except Special and Career/Technical Education | $77,927 |
References
- IPEDS — Integrated Postsecondary Education Data System
- U.S. Department of Education — College Scorecard
- O*NET Online (Bureau of Labor Statistics)
- National Center for Education Statistics
More about our data sources and methodologies.
Course Advisor provides higher-education, college and university, degree, program, career, salary, and other helpful information to students, faculty, institutions, and other internet audiences. Presented information and data are subject to change. Inclusion on this website does not imply or represent a direct relationship with the company, school, or brand. Information, though believed correct at time of publication, may not be correct, and no warranty is provided. Contact the schools to verify any information before relying on it. Financial aid may be available for those who qualify. The displayed options may include sponsored or recommended results, not necessarily based on your preferences.
© Course Advisor – All Rights Reserved.