University of Phoenix - California Overview
Located in Ontario, California, University of Phoenix - California is a private for-profit institution. The location of the school is great for students who enjoy the amenities of city life.
What Is University of Phoenix - California Known For?
- Students who want to work more closely with their professors have an easier time at UOPX - California since the student to facuty ratio is 7 to 1.
- The master's degree is the highest award offered at UOPX - California.
- In a recent academic period6% of the faculty were full-time.
Where Is University of Phoenix - California?
Contact details for UOPX - California are given below.
| Contact Details | |
|---|---|
| Address: | 3110 East Guasti Road, Ontario, CA 91761 |
| Phone: | 866-766-0766 |
| Website: | www.phoenix.edu |
How Do I Get Into UOPX - California?
You can apply to UOPX - California online at: https://www.phoenix.edu/application/quick-app
Can I Afford University of Phoenix - California?
Explore Best Ranked Schools for You
University of Phoenix - California Undergraduate Student Diversity
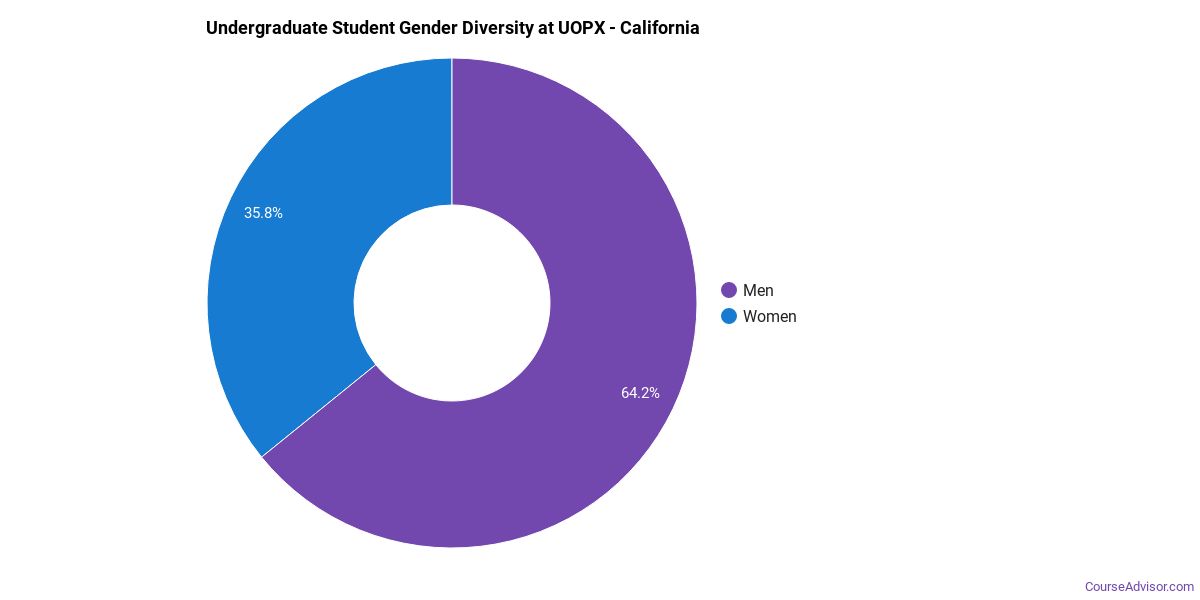
Gender Diversity
Of the 2,392 full-time undergraduates at UOPX - California, 64% are male and 36% are female.
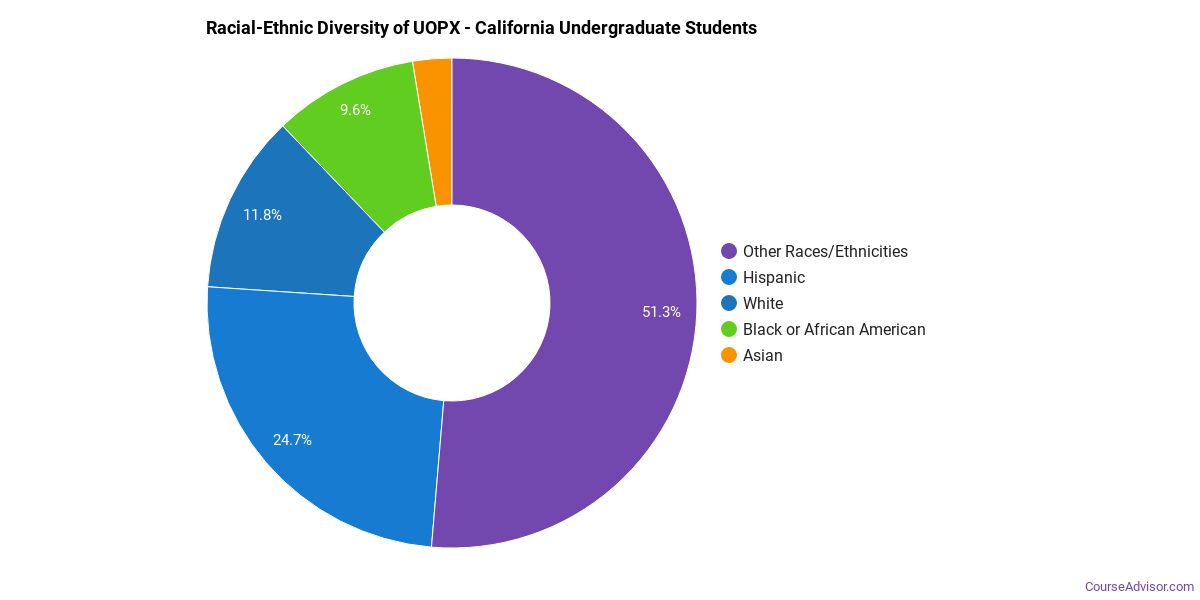
Racial-Ethnic Diversity
The racial-ethnic breakdown of University of Phoenix - California students is as follows.
| Race/Ethnicity | Number of Grads |
|---|---|
| Asian | 80 |
| Black or African American | 218 |
| Hispanic or Latino | 578 |
| White | 329 |
| International Students | 2 |
| Other Races/Ethnicities | 1,185 |
University of Phoenix - California Undergraduate Concentrations
The table below shows the number of awards for each concentration.
| Major | Basic Certificate | Bachelor’s | Master’s | TOTAL |
|---|---|---|---|---|
| Business Administration & Management | 43 | 179 | 43 | 265 |
| Mental & Social Health Services | 0 | 0 | 57 | 57 |
| Human Resource Management | 24 | 0 | 0 | 24 |
| Criminal Justice & Corrections | 1 | 18 | 0 | 19 |
| Accounting | 0 | 14 | 0 | 14 |
| Nursing | 0 | 2 | 11 | 13 |
| Marketing | 9 | 0 | 0 | 9 |
| Computer Information Systems | 0 | 4 | 0 | 4 |
| Health & Medical Administrative Services | 1 | 3 | 0 | 4 |
| Behavioral Science | 0 | 3 | 0 | 3 |
| Community Organization & Advocacy | 0 | 2 | 0 | 2 |
| Human Services | 0 | 2 | 0 | 2 |
| Communication & Media Studies | 0 | 1 | 0 | 1 |
| Educational Administration | 0 | 0 | 1 | 1 |
| Clinical, Counseling & Applied Psychology | 0 | 1 | 0 | 1 |
| TOTAL | 78 | 229 | 112 | 419 |
References
*The racial-ethnic minorities count is calculated by taking the total number of students and subtracting white students, international students, and students whose race/ethnicity was unknown. This number is then divided by the total number of students at the school to obtain the racial-ethnic minorities percentage.
More about our data sources and methodologies.
Course Advisor provides higher-education, college and university, degree, program, career, salary, and other helpful information to students, faculty, institutions, and other internet audiences. Presented information and data are subject to change. Inclusion on this website does not imply or represent a direct relationship with the company, school, or brand. Information, though believed correct at time of publication, may not be correct, and no warranty is provided. Contact the schools to verify any information before relying on it. Financial aid may be available for those who qualify. The displayed options may include sponsored or recommended results, not necessarily based on your preferences.
© Course Advisor – All Rights Reserved.