Find Schools

Study Area & Zipcode

University of New Hampshire - Main Campus

Find Schools Near

University of New Hampshire - Main Campus Overview

University of New Hampshire - Main Campus is a public institution located in Durham, New Hampshire. Durham is a good match for students who enjoy the safety and convenience of the suburbs.

What Is University of New Hampshire - Main Campus Known For?

3,381 Undergraduate Awards
$41,007 Avg Cost After Aid
85% Acceptance Rate
  • The 2% student loan default rate at UNH is better than the national rate of 10.1%. That's a good sign that you may be able to pay off student loans easier than your peers at other schools can.
  • The doctor's degree is the highest award offered at UNH.
  • For the 2017-2018 academic year, 76% of the faculty were full-time.
  • After graduation, UNH bachelor's degree recipients go on to jobs where they make $51,400 a year. That's about 26% more than their peers at other schools.
  • On average, it takes about 4.1 years for students from UNH to earn a bachelor's degree. This is excellent when compared to the average of 4.4 years.

Best Schools

University of New Hampshire - Main Campus Rankings

We have ranked UNH as #173 out of 2,587 colleges and universities in the country in our 2022 Best Colleges list. This puts it in the top 10% of all schools in the nation. It is also ranked #4 out of 19 schools in New Hampshire.

Our rankings are based on an outcomes-based approach rather than subjective ones used by other media outlets. As such, we utilize data from the Integrated Postsecondary Education Data System (IPEDS) and the College Scorecard, among other sources. Visit our rankings and methodology section to learn more.

UNH has also been awarded the following overall awards by our latest rankings.

Rank Ranking Name Share
#160 Best Bachelor’s Degree Schools Tweet It - Post It
#165 Best Associate Degree Schools Tweet It - Post It
#192 Best Master’s Degree Schools Tweet It - Post It

Program Level Awards

These are highlights of some of the most noteworthy awards granted to specific programs at UNH.

Rank Ranking Name Share
#1 Best Genetics Bachelor’s Degree Schools Tweet It - Post It
#3 Best Recreation Administration Bachelor’s Degree Schools Tweet It - Post It
#8 Best Music Master’s Degree Schools Tweet It - Post It
#26 Best Visual & Performing Arts Master’s Degree Schools Tweet It - Post It
#28 Best Biological & Biomedical Sciences Master’s Degree Schools Tweet It - Post It
#33 Best Parks, Recreation, Leisure & Fitness Bachelor’s Degree Schools Tweet It - Post It
#53 Best Communication & Journalism Bachelor’s Degree Schools Tweet It - Post It
#58 Best Business Administration & Management Bachelor’s Degree Schools Tweet It - Post It
#74 Best Computer & Information Sciences Bachelor’s Degree Schools Tweet It - Post It
#81 Best Business, Management & Marketing Bachelor’s Degree Schools Tweet It - Post It

Awards From Around the Web

The following table lists some notable awards UNH has earned from around the web.

Rank Ranking Name Source
#5 Best Recreation Administration Schools College Factual
#50 Best Parks, Recreation, Leisure, & Fitness Studies Schools College Factual
#57 Best Business Administration & Management Schools College Factual
#58 Best Communication & Journalism Schools College Factual
#94 Best Business, Management & Marketing Schools College Factual
#120 Best Business Schools Business Degree Central

Where Is University of New Hampshire - Main Campus?

undefined

Contact details for UNH are given below.

Contact Details
Address: 105 Main St., Thompson Hall, Durham, NH 03824-3547
Phone: 603-862-1234
Facebook: https://www.facebook.com/universityofnewhampshire
Twitter: http://www.twitter.com/uofnh

How Do I Get Into UNH?

You can apply to UNH online at: www.commonapp.org/

Admission Requirements for UNH

Submission Required?
High School GPA required
High School Rank considered but not required
High School Transcript required
College Prep Program required
Recommendations required
SAT or ACT Scores considered but not required
TOEFL required

How Hard Is It To Get Into UNH?

85% Acceptance Rate
61% Of Accepted Are Women
76% Submit SAT Scores
The acceptance rate at University of New Hampshire - Main Campus is 85%. This means that is not quite as selective as some schools, but you'll still need to submit a good application if you want to be considered by the admissions department.

Approximately 39% of accepted students are men and 61% are women. The acceptance rate for men is 80%, and the acceptance rate for women is 88%.

Average Test Scores

About 76% of students accepted to UNH submitted their SAT scores. When looking at the 25th through the 75th percentile, SAT Evidence-Based Reading and Writing scores ranged between 550 and 640. Math scores were between 540 and 640.

SAT Reading and Writing Scores for University of New Hampshire - Main Campus  ( 550 to 640 )
200
800

SAT Math Scores for University of New Hampshire - Main Campus  ( 540 to 640 )
200
800
UNH received ACT scores from 10% of accepted students. When looking at the 25th through the 75th percentile, ACT English scores ranged between 22 and 31. Math scores were between 23 and 29. Composite scores were between 24 and 30.

ACT English Scores for University of New Hampshire - Main Campus  ( 22 to 31 )
1
36
ACT Math Scores for University of New Hampshire - Main Campus  ( 23 to 29 )
1
36
ACT Composite Scores for University of New Hampshire - Main Campus  ( 24 to 30 )
1
36

Can I Afford University of New Hampshire - Main Campus?

$41,007 Net Price
68% Take Out Loans
2.0% Loan Default Rate
The overall average net price of UNH is $41,007. The affordability of the school largely depends on your financial need since net price varies by income group.

The net price is calculated by adding tuition, room, board and other costs and subtracting financial aid.

Student Loan Debt

While almost two-thirds of students nationwide take out loans to pay for college, the percentage may be quite different for the school you plan on attending. At UNH, approximately 68% of students took out student loans averaging $10,846 a year. That adds up to $43,384 over four years for those students.

The student loan default rate at UNH is 2.0%. This is significantly lower than the national default rate of 10.1%, which is a good sign that you'll be able to pay back your student loans.

University of New Hampshire - Main Campus Undergraduate Student Diversity

11,382 Full-Time Undergraduates
56% Women
10% Racial-Ethnic Minorities*
There are 11,787 undergraduate students at UNH, with 11,382 being full-time and 405 being part-time.

undefined

There are also 2,561 graduate students at the school.

Gender Diversity

Of the 11,382 full-time undergraduates at UNH, 44% are male and 56% are female.

undefined

Racial-Ethnic Diversity

The racial-ethnic breakdown of University of New Hampshire - Main Campus students is as follows.

undefined
Race/Ethnicity Number of Grads
Asian 337
Black or African American 120
Hispanic or Latino 400
White 9,514
International Students 270
Other Races/Ethnicities 741

Geographic Diversity

New Hampshire students aren't the only ones who study at University of New Hampshire - Main Campus. At this time, 33 states are represented by the student population at the school.

Over 81 countries are represented at UNH. The most popular countries sending students to the school are China, India, and Iran.

Online Learning at University of New Hampshire - Main Campus

1,331 Took All Classes Online
11,691 Took At Least One Class Online
52.7% Avg Growth Over 4 Years
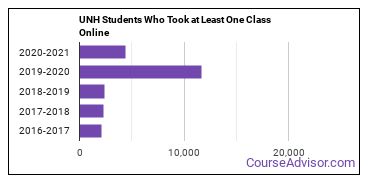
In 2019-2020, 11,691 students took at least one online class at the school.

The following chart shows how the online learning population at UNH has changed over the last few years.
undefined

This school is the 12th most popular in New Hampshire for online learning according to the online graduations recorded by the Department of Education for the academic year 2019-2020.

Online Affordability Rankings of UNH

The following table shows how UNH is ranked for affordability for both in-state and out-of-state students among colleges and universities that are not mostly online.

Major Tuition for In-State Students Tuition for Out-of-State Students
Management Sciences & Quantitative Methods #28 #46
General Business/Commerce #43 #63
Homeland Security #48 #60
Social Work #73 #73

Online Growth Rankings of UNH

The average growth rate over the last four years of online students at University of New Hampshire - Main Campus was 52.7%. This is the #648 largest growth rate of all schools that are only partially online. This refers to all students at UNH regardless of major.

The following table shows the 1-year growth rate of UNH majors that offer at least one online course. This table only includes majors with positive growth.

Major 1-Year Growth Rate
Educational Administration 4%
Electrical Engineering 4%
Health Professions 0%
Homeland Security 90%
Homeland Security, Law Enforcement & Firefighting 90%
Nursing 12%
Rehabilitation & Therapeutic Professions 9%

The table below shows how the average growth rate over 4 years at UNH ranks compared to all other partially online schools that offer a specific major. Note that the majors may or may not be offered online at UNH.

Major Growth Rate Rank
Electrical Engineering #16
Homeland Security #28
Rehabilitation & Therapeutic Professions #31
Social Work #39
Engineering #58
General Business/Commerce #76
Educational Administration #109
Public Administration & Social Service #111
Homeland Security, Law Enforcement & Firefighting #203
Nursing #213
Education #349

When we speak of partially online, we are referring to schools whose online population is less than 50% of its total student body. Mostly online refers to those with online populations greater than or equal to 50%.

University of New Hampshire - Main Campus Undergraduate Concentrations

The table below shows the number of awards for each concentration.

Major Associate’s Bachelor’s Graduate Certificate Master’s Doctor’s TOTAL
Business Administration & Management 0 844 0 0 0 844
General Psychology 0 197 0 3 1 201
General Biology 0 166 0 4 1 171
Communication & Media Studies 0 164 0 0 0 164
Nursing 0 67 31 54 12 164
Mechanical Engineering 0 122 0 11 3 136
Social Work 0 46 2 78 0 126
Rehabilitation & Therapeutic Professions 0 40 13 65 0 118
General English Literature 0 101 0 7 3 111
Natural Resources Conservation 0 80 0 15 12 107
Political Science & Government 0 94 0 4 0 98
Civil Engineering 0 72 0 17 6 95
Computer Information Systems 0 71 0 21 1 93
Nutrition Science 0 72 0 14 0 86
Teacher Education Grade Specific 0 0 0 79 0 79
Human Development & Family Studies 0 71 0 8 0 79
Recreation Administration 0 59 0 8 0 67
Criminology 0 55 0 10 0 65
Sociology 0 54 0 2 5 61
Health & Physical Education 0 51 0 9 0 60
General Business/Commerce 1 0 0 58 0 59
Economics 0 49 0 1 3 53
History 0 42 0 9 0 51
Communication Sciences 0 29 0 21 0 50
Electrical Engineering 0 43 2 4 0 49
Management Sciences & Quantitative Methods 0 0 22 25 0 47
Health & Medical Administrative Services 0 39 0 0 0 39
Neurobiology & Neurosciences 0 37 0 0 0 37
International Relations & National Security 0 37 0 0 0 37
Environmental Engineering 0 35 0 0 0 35
Chemical Engineering 0 32 0 0 1 33
Biochemistry, Biophysics & Molecular Biology 0 29 0 1 2 32
Romance Languages 0 32 0 0 0 32
Wildlife Management 0 32 0 0 0 32
Hospitality Management 0 31 0 0 0 31
Agricultural Production 0 29 0 0 0 29
Biomedical Engineering 0 29 0 0 0 29
Educational Administration 0 0 3 25 0 28
Music 0 25 0 2 0 27
Accounting 0 0 0 26 0 26
Animal Science 11 13 0 0 0 24
Mathematics 0 10 0 12 2 24
Geological & Earth Sciences 0 10 7 6 1 24
Zoology 0 21 0 0 2 23
Allied Health Professions 0 23 0 0 0 23
Physics 0 11 0 4 8 23
Sustainability Science 0 22 0 0 0 22
Drama & Theater Arts 0 22 0 0 0 22
Natural Resource Management 0 21 0 0 0 21
Genetics 0 17 0 2 1 20
Ethnic Studies 0 17 3 0 0 20
Biological & Biomedical Sciences (Other) 0 16 0 0 2 18
General Education 0 17 0 0 0 17
Ocean Engineering 0 7 6 4 0 17
Chemistry 0 8 0 4 5 17
Public Policy 0 0 0 17 0 17
Writing Studies 0 0 0 16 0 16
Applied Mathematics 0 15 0 0 1 16
Forestry 4 11 0 0 0 15
Anthropology 0 15 0 0 0 15
Philosophy 0 14 0 0 0 14
Fine & Studio Arts 0 13 0 0 0 13
Statistics 0 10 0 1 1 12
Other Multi/Interdisciplinary Studies 0 11 0 0 0 11
Computer Engineering 0 10 0 0 0 10
Homeland Security 0 6 0 4 0 10
Other Agriculture 0 0 0 6 2 8
Teacher Education Subject Specific 0 7 0 0 1 8
Geography & Cartography 0 8 0 0 0 8
Linguistics & Comparative Literature 0 7 0 0 0 7
Public Health 0 0 1 6 0 7
Public Administration 0 0 0 7 0 7
Urban & Regional Planning 0 6 0 0 0 6
Other Education 0 0 1 0 5 6
Special Education 0 0 0 6 0 6
Classical Languages & Literature 0 5 0 0 0 5
Slavic, Baltic & Albanian Languages 0 5 0 0 0 5
Liberal Arts General Studies 0 4 0 1 0 5
Engineering Physics 0 4 0 0 0 4
Materials Sciences 0 0 0 2 1 3
Microbiological Sciences & Immunology 0 0 0 2 0 2
Germanic Languages 0 2 0 0 0 2
Dietetics & Clinical Nutrition Services 0 0 2 0 0 2
Area Studies 0 1 0 0 0 1
Botany/Plant Biology 0 0 0 0 0 0
Curriculum & Instruction 0 0 0 0 0 0
Educational Assessment 0 0 0 0 0 0
Civil Engineering Technology 0 0 0 0 0 0
Other Engineering 0 0 0 0 0 0
Systems Engineering 0 0 0 0 0 0
Mental & Social Health Services 0 0 0 0 0 0
Other Health Professions 0 0 0 0 0 0
TOTAL 16 3,365 93 681 82 4,237

References

*The racial-ethnic minorities count is calculated by taking the total number of students and subtracting white students, international students, and students whose race/ethnicity was unknown. This number is then divided by the total number of students at the school to obtain the racial-ethnic minorities percentage.

More about our data sources and methodologies.

Featured Schools

Find Schools Near You

Our free school finder matches students with accredited colleges across the U.S.