Ethnic Studies at University of Nebraska-Lincoln
If you plan to study Ethnic Studies, you may want to check out the program at University of Nebraska-Lincoln. The following information will help you decide if it is a good fit for you.
University of Nebraska-Lincoln sits in Lincoln, NE.
For the most recent IPEDS reporting year, 11 ethnic studies degrees were granted at University of Nebraska-Lincoln.
Featured schools near , edit
Online Class Availability at University of Nebraska-Lincoln
Many students take online classes at University of Nebraska-Lincoln. Among 24,393 students, 1,697 (7%) studied exclusively online and 14,051 (58%) took at least some classes online.
Earnings for Ethnic Studies Graduates from University of Nebraska-Lincoln
Graduates of University of Nebraska-Lincoln’s Ethnic Studies program earn at the following median levels (per the U.S. Department of Education’s College Scorecard):

| Years After Graduation | Median Earnings |
|---|---|
| 2 years | $28,381 |
| 3 years | $30,868 |
| 4 years | $30,046 |
How does this compare to the school overall? Four years after graduating, Ethnic Studies graduates from University of Nebraska-Lincoln take home a median $30,046, compared with $61,163 for all University of Nebraska-Lincoln graduates — about 51% lower than the school-wide median.

Median Debt at Graduation
The median debt for Ethnic Studies graduates from University of Nebraska-Lincoln stands at $20,527.
Student Demographics & Diversity
Below you’ll find the composition of Ethnic Studies graduates at University of Nebraska-Lincoln, by degree type.
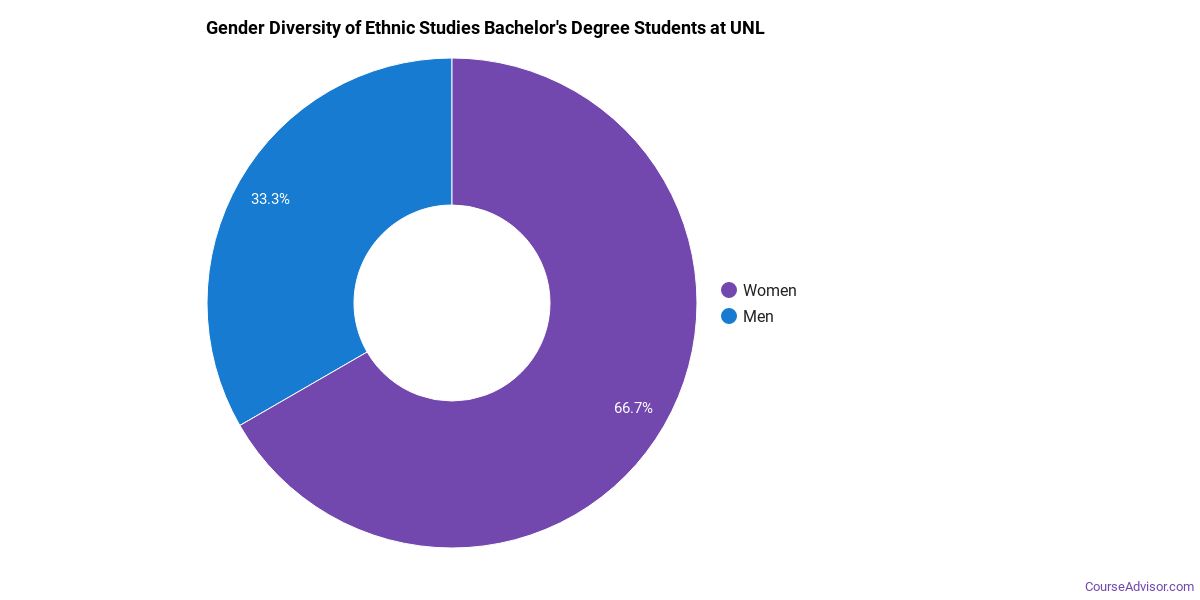
Program-wide, Ethnic Studies graduates at University of Nebraska-Lincoln are 100% women (11) and 0% men (0).
Ethnic Studies Bachelor’s Program at University of Nebraska-Lincoln
Of the 11 bachelor’s ethnic studies graduates at University of Nebraska-Lincoln, 100% were women (11) and 0% were men (0).
The following table and chart show the race/ethnicity of Ethnic Studies bachelor’s degree recipients at University of Nebraska-Lincoln.
| Race / Ethnicity | Number of Graduates |
|---|---|
| White | 6 |
| Hispanic / Latino | 1 |
| Black / African American | 1 |
| International (Nonresident) | 3 |
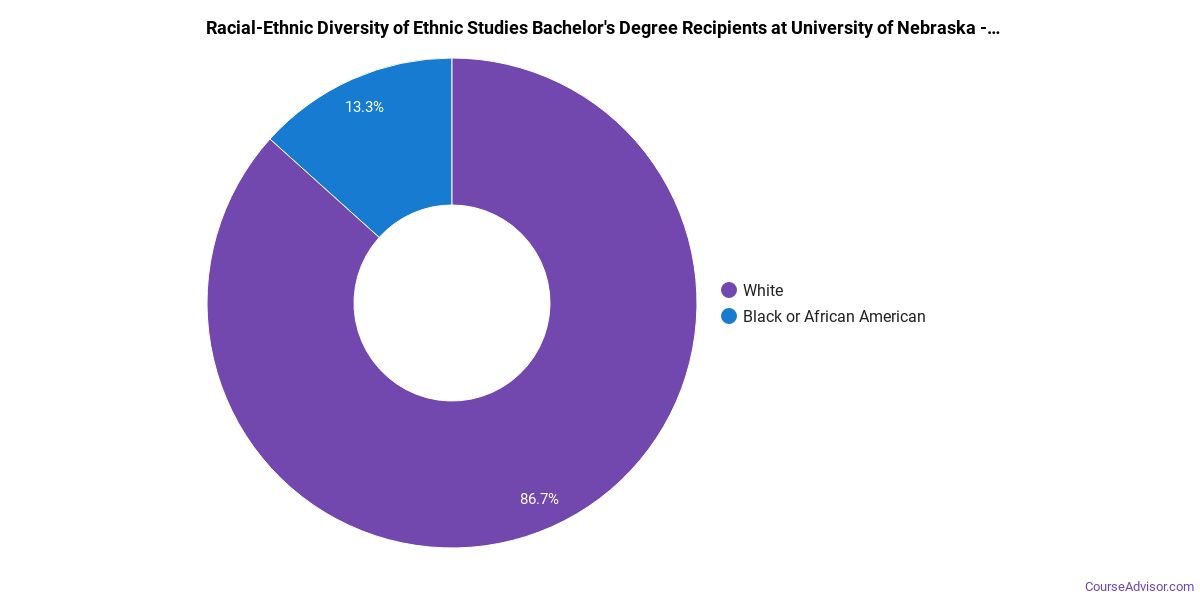
Minority students account for 18% of Ethnic Studies bachelor’s degree recipients at University of Nebraska-Lincoln, below the national average of 66%.*
*The racial-ethnic minorities figure is the total number of graduates minus White, international (nonresident), and unknown-race graduates.
More Specific Ethnic Studies Concentrations at University of Nebraska-Lincoln
The Ethnic Studies program at University of Nebraska-Lincoln includes the following sub-specializations:
| Concentration | Graduates |
|---|---|
| Women’s Studies | 8 |
| Other Ethnic Studies | 3 |
Best-Paid Careers for Ethnic Studies Graduates
Graduates of the Ethnic Studies program at University of Nebraska-Lincoln go on to a range of careers. Below are the best-paid careers for Ethnic Studies graduates, ordered by median annual salary:
| Occupation | Nationwide Median Wage |
|---|---|
| Interpreters and Translators | $52,627 |
| Area, Ethnic, and Cultural Studies Teachers, Postsecondary | $47,517 |
References
- IPEDS — Integrated Postsecondary Education Data System
- U.S. Department of Education — College Scorecard
- O*NET Online (Bureau of Labor Statistics)
- National Center for Education Statistics
More about our data sources and methodologies.
Course Advisor provides higher-education, college and university, degree, program, career, salary, and other helpful information to students, faculty, institutions, and other internet audiences. Presented information and data are subject to change. Inclusion on this website does not imply or represent a direct relationship with the company, school, or brand. Information, though believed correct at time of publication, may not be correct, and no warranty is provided. Contact the schools to verify any information before relying on it. Financial aid may be available for those who qualify. The displayed options may include sponsored or recommended results, not necessarily based on your preferences.
© Course Advisor – All Rights Reserved.