Liberal Arts at University of Memphis
If you plan to study Liberal Arts, take a look at what University of Memphis. The following information will help you decide if it is a good fit for you.
University of Memphis is in Memphis, TN.
During the most recent reporting year, 66 liberal arts degrees were awarded at University of Memphis.
Featured schools near , edit
Online & Distance Learning at University of Memphis
Distance learning is available at University of Memphis. Among 20,276 students, 5,051 (25%) were enrolled entirely in distance education and 7,430 (37%) took at least some classes online.
Student Demographics & Diversity
Take a look at the student demographics for Liberal Arts graduates at University of Memphis, broken down by degree level.
Program-wide, Liberal Arts graduates at University of Memphis are 45% women (30) and 55% men (36).
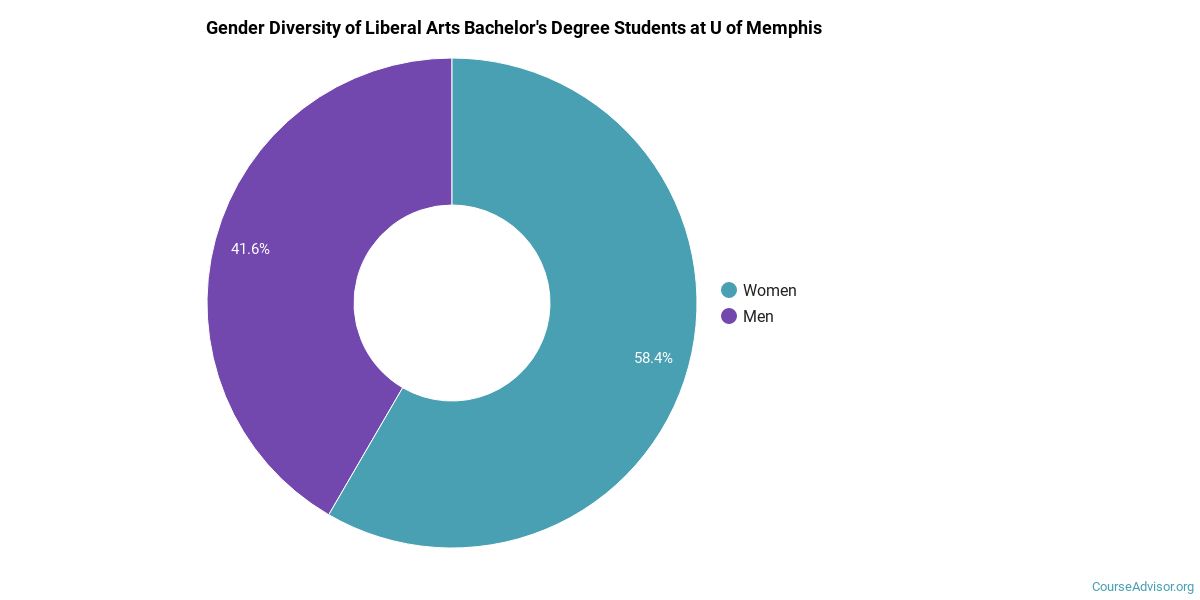
Liberal Arts Bachelor’s Program at University of Memphis
Of the 53 bachelor’s liberal arts degrees awarded at University of Memphis, 36% were women (19) and 64% were men (34).
The following table and chart show the race/ethnicity of Liberal Arts bachelor’s degree recipients at University of Memphis.
| Race / Ethnicity | Number of Graduates |
|---|---|
| White | 15 |
| Black / African American | 32 |
| Two or More Races | 4 |
| International (Nonresident) | 2 |

Minority students account for 68% of Liberal Arts bachelor’s degree recipients at University of Memphis, above the national average of 46%.*
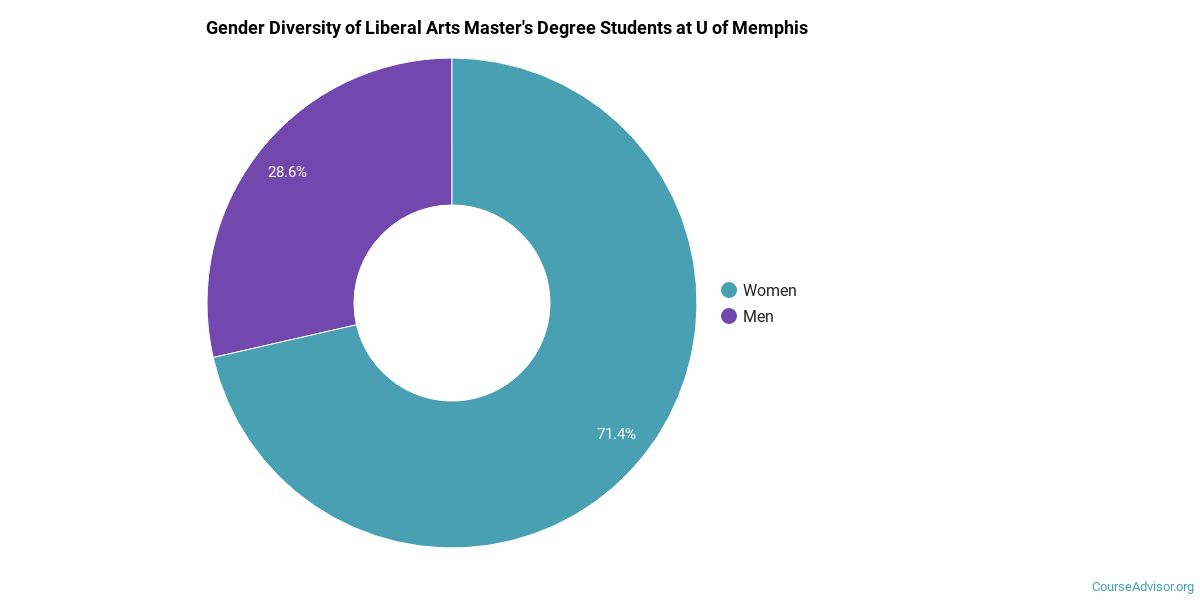
Liberal Arts Master’s Program at University of Memphis
Of the 3 master’s liberal arts degrees awarded at University of Memphis, 100% were women (3) and 0% were men (0).
The following table and chart show the race/ethnicity of Liberal Arts master’s degree recipients at University of Memphis.
| Race / Ethnicity | Number of Graduates |
|---|---|
| White | 1 |
| Hispanic / Latino | 1 |
| Two or More Races | 1 |

Racial-ethnic minorities make up 67% of Liberal Arts master’s degree recipients at University of Memphis, higher than the national average of 29%.*
Liberal Arts Doctoral Program at University of Memphis
Of the 6 doctoral liberal arts graduates at University of Memphis, 67% were women (4) and 33% were men (2).

The following table and chart show the race/ethnicity of Liberal Arts doctoral degree recipients at University of Memphis.
| Race / Ethnicity | Number of Graduates |
|---|---|
| White | 1 |
| Black / African American | 4 |
| International (Nonresident) | 1 |

Racial-ethnic minorities make up 67% of Liberal Arts doctoral degree recipients at University of Memphis, above the national average of 37%.*
*The racial-ethnic minorities figure is the total number of graduates minus White, international (nonresident), and unknown-race graduates.
Best-Paid Careers for Liberal Arts Graduates
Those who complete Liberal Arts program at University of Memphis go on to a range of careers. Below are the best-paid careers for Liberal Arts majors, ordered by median annual salary:
| Occupation | Nationwide Median Wage |
|---|---|
| Postsecondary Teachers, All Other | $68,967 |
References
- IPEDS — Integrated Postsecondary Education Data System
- U.S. Department of Education — College Scorecard
- O*NET Online (Bureau of Labor Statistics)
- National Center for Education Statistics
More about our data sources and methodologies.
Course Advisor provides higher-education, college and university, degree, program, career, salary, and other helpful information to students, faculty, institutions, and other internet audiences. Presented information and data are subject to change. Inclusion on this website does not imply or represent a direct relationship with the company, school, or brand. Information, though believed correct at time of publication, may not be correct, and no warranty is provided. Contact the schools to verify any information before relying on it. Financial aid may be available for those who qualify. The displayed options may include sponsored or recommended results, not necessarily based on your preferences.
© Course Advisor – All Rights Reserved.