General Agriculture at University of Delaware
If you plan to study General Agriculture, consider the program at University of Delaware. The following information will help you decide if it is a good fit for you.
University of Delaware sits in Newark, DE.
For the most recent IPEDS reporting year, 12 general agriculture degrees were granted at University of Delaware.
Featured schools near , edit
Studying Online at University of Delaware
Many students take online classes at University of Delaware. Of 24,412 students, 1,739 (7%) were enrolled entirely in distance education and 9,180 (38%) took at least some classes online.
General Agriculture Rankings at University of Delaware
These rankings give you a sense of how University of Delaware’s General Agriculture program to other colleges that offer this major.
Bachelor’s-Level Rankings
| Ranking | Scope | Rank |
|---|---|---|
| Best Schools (Quality) | Delaware | #1 of 2 |
| Best Value | Delaware | #2 of 2 |
| Best Value | Middle Atlantic (Region) | #4 of 7 |
| Best Schools (Quality) | Middle Atlantic (Region) | #5 of 7 |
| Best Schools (Quality) | Nationwide | #49 of 84 |
| Best Value | Nationwide | #63 of 84 |
Associate-Level Rankings
| Ranking | Scope | Rank |
|---|---|---|
| Best Schools (Quality) | Delaware | #1 of 2 |
| Best Value | Delaware | #2 of 2 |
| Best Value | Middle Atlantic (Region) | #4 of 7 |
| Best Schools (Quality) | Middle Atlantic (Region) | #5 of 7 |
| Best Schools (Quality) | Nationwide | #49 of 84 |
| Best Value | Nationwide | #63 of 84 |
Earnings for General Agriculture Graduates from University of Delaware
Graduates of University of Delaware’s General Agriculture program earn the following amounts (per the U.S. Department of Education’s College Scorecard):
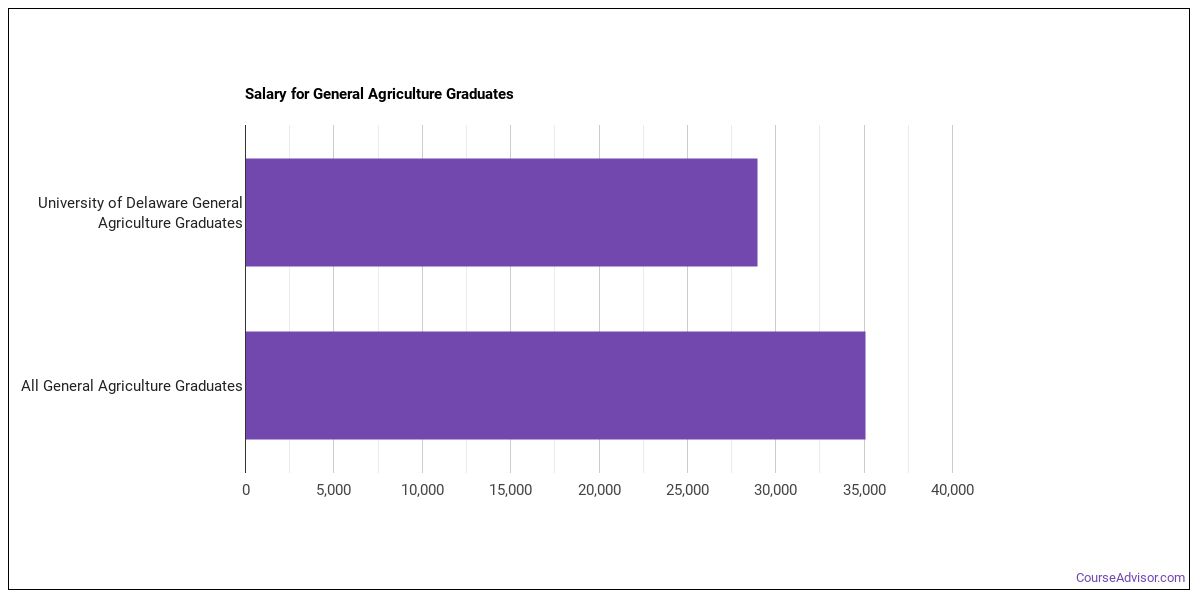
| Years After Graduation | Median Earnings |
|---|---|
| 1 year | $28,961 |
| 2 years | $33,281 |
Median Debt at Graduation
Typical debt at graduation for General Agriculture graduates from University of Delaware is $24,372.
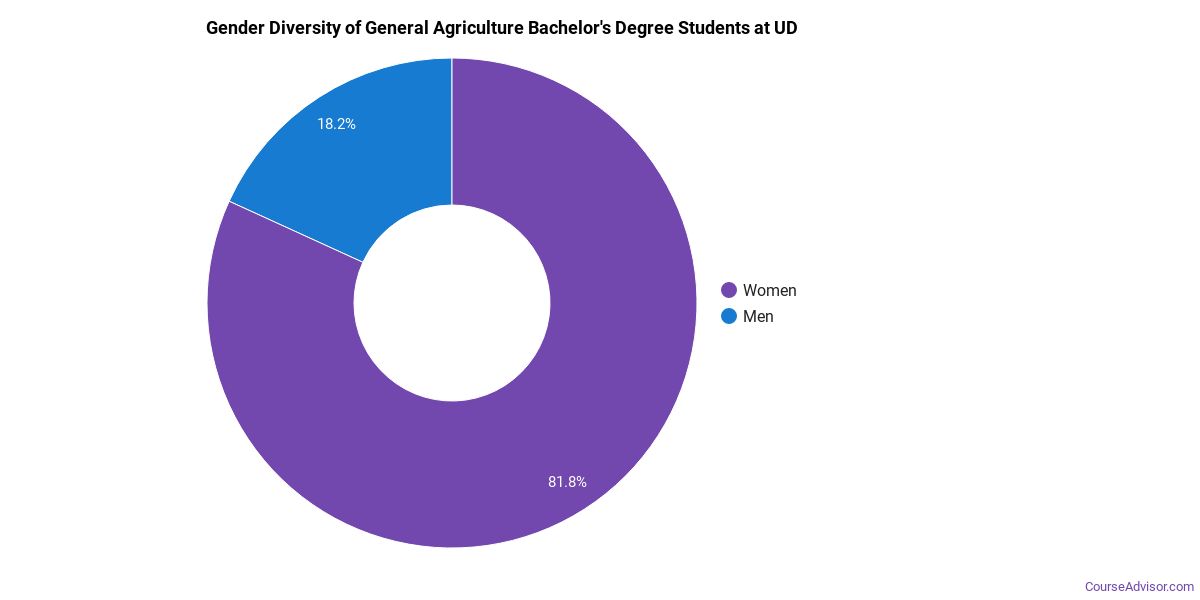
Student Demographics & Diversity
Take a look at the diversity of General Agriculture graduates at University of Delaware, by degree type.
Program-wide, General Agriculture graduates at University of Delaware are 67% women (8) and 33% men (4).
General Agriculture Bachelor’s Program at University of Delaware
Of the 12 bachelor’s general agriculture graduates at University of Delaware, 67% were women (8) and 33% were men (4).
The following table and chart show the race/ethnicity of General Agriculture bachelor’s degree recipients at University of Delaware.
| Race / Ethnicity | Number of Graduates |
|---|---|
| White | 10 |
| Hispanic / Latino | 1 |
| Black / African American | 1 |
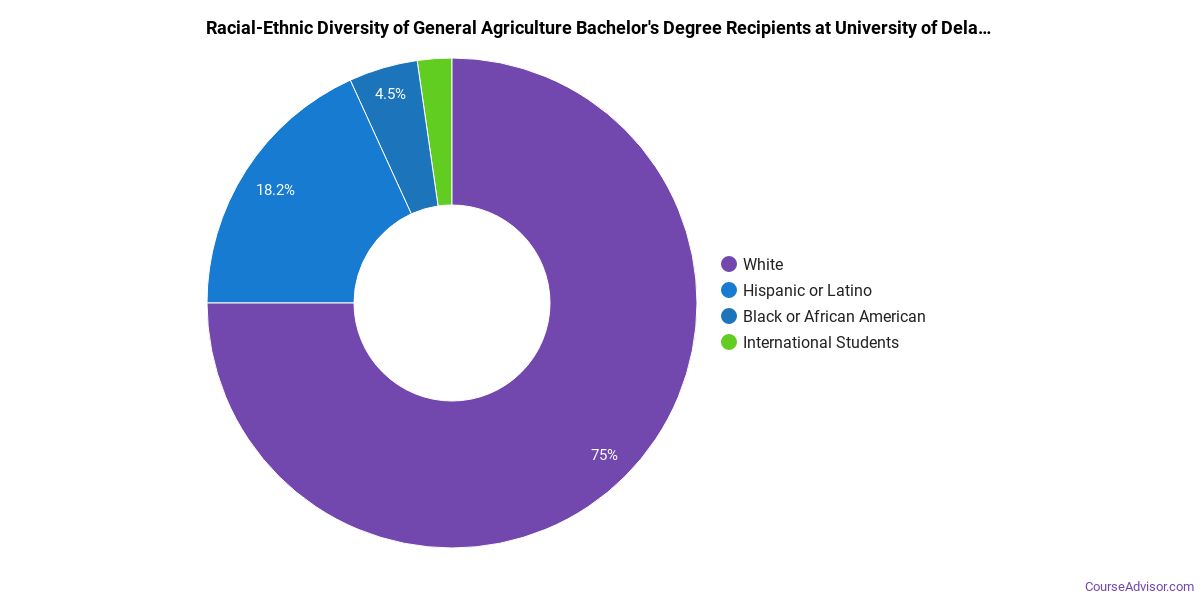
Racial-ethnic minorities make up 17% of General Agriculture bachelor’s degree recipients at University of Delaware, below the national average of 36%.*
*The racial-ethnic minorities figure is the total number of graduates minus White, international (nonresident), and unknown-race graduates.
More Specific General Agriculture Concentrations at University of Delaware
The General Agriculture program at University of Delaware offers more specialized concentrations:
| Concentration | Graduates |
|---|---|
| Agriculture | 12 |
Top-Paying Careers for General Agriculture Graduates
Students who finish General Agriculture program at University of Delaware go on to a range of careers. Below are the best-paid careers for General Agriculture graduates, ordered by median annual salary:
| Occupation | Nationwide Median Wage |
|---|---|
| Animal Scientists | $93,823 |
| Agricultural Sciences Teachers, Postsecondary | $66,903 |
| Soil and Plant Scientists | $59,587 |
| Precision Agriculture Technicians | $56,932 |
| Food Scientists and Technologists | $55,930 |
| Agricultural Technicians | $44,022 |
References
- IPEDS — Integrated Postsecondary Education Data System
- U.S. Department of Education — College Scorecard
- O*NET Online (Bureau of Labor Statistics)
- National Center for Education Statistics
More about our data sources and methodologies.
Course Advisor provides higher-education, college and university, degree, program, career, salary, and other helpful information to students, faculty, institutions, and other internet audiences. Presented information and data are subject to change. Inclusion on this website does not imply or represent a direct relationship with the company, school, or brand. Information, though believed correct at time of publication, may not be correct, and no warranty is provided. Contact the schools to verify any information before relying on it. Financial aid may be available for those who qualify. The displayed options may include sponsored or recommended results, not necessarily based on your preferences.
© Course Advisor – All Rights Reserved.