Finance & Financial Management at University of Cincinnati - Clermont College
UC Clermont College is located in Batavia, Ohio and has a total student population of 7,504.
Want to know more about the career opportunities in this field? Check out the Careers in Finance & Financial Management section at the bottom of this page.
UC Clermont College Finance & Financial Management Degrees Available
- Associate’s Degree in Finance
UC Clermont College Finance & Financial Management Rankings
Find University of Cincinnati - Clermont College Programs
Managing and quantifying money is at the heart of the online bachelor's degree in finance at SNHU. You'll learn the fundamentals of investments, address key managerial issues, examine ethics from every angle and build the skillset to be a player in the multidimensional business marketplace.

Prepare to advance your current career in finance with Southern New Hampshire University's online Master's in Finance degree program.
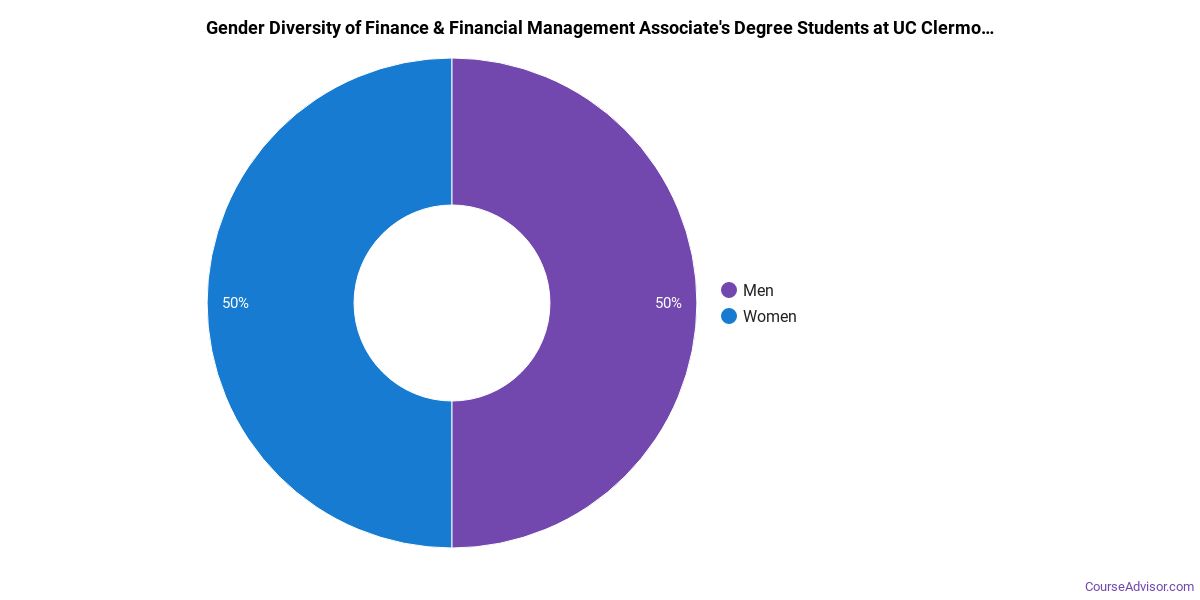
Finance Student Demographics at UC Clermont College
Take a look at the following statistics related to the make-up of the finance majors at University of Cincinnati - Clermont College.
UC Clermont College Finance & Financial Management Associate’s Program
The majority of those who receive an associate's degree in finance at UC Clermont College are white. Around 60% fell into this category, which is typical for this degree. UC Clermont College does a better job with serving racial-ethnic minorities than the typical school does. Its associate's program in finance graduates 13% more racial-ethnic minorities than the nationwide average.*
The following table and chart show the race/ethnicity for students who recently graduated from University of Cincinnati - Clermont College with a associate's in finance.
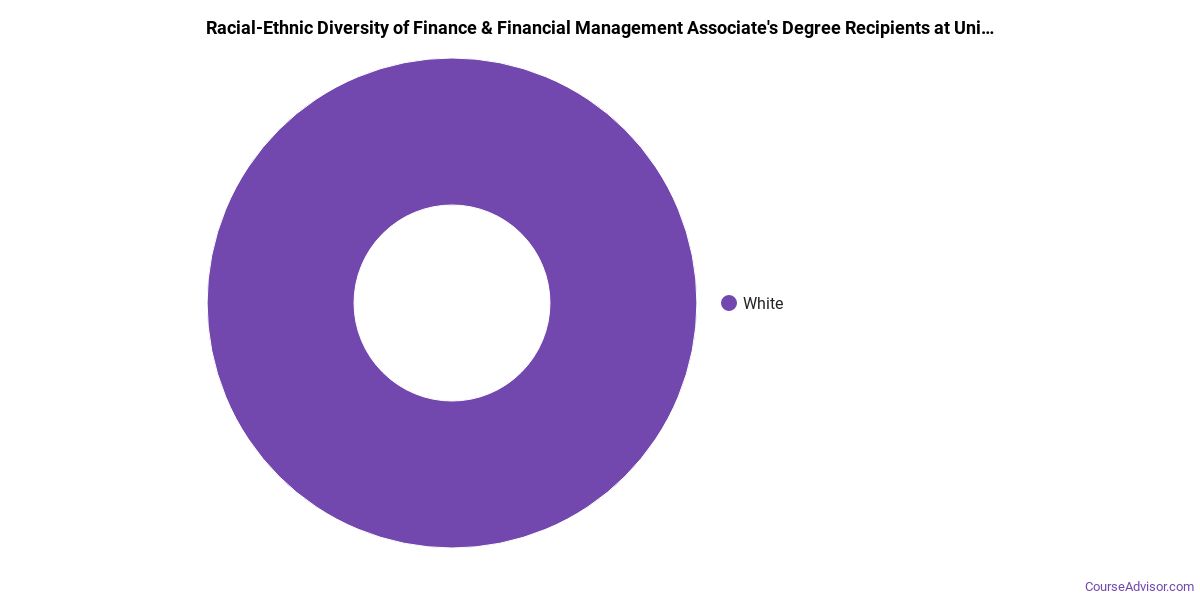
| Race/Ethnicity | Number of Students |
|---|---|
| Asian | 0 |
| Black or African American | 1 |
| Hispanic or Latino | 1 |
| White | 3 |
| International Students | 0 |
| Other Races/Ethnicities | 0 |
Concentrations Within Finance & Financial Management
Finance & Financial Management majors may want to concentrate their studies in one of these areas. The completion numbers here include all graduates who receive any type of degree in this field from University of Cincinnati - Clermont College. Some of these focus areas may not be available for your degree level.
| Concentration | Annual Degrees Awarded |
|---|---|
| Finance | 2 |
Related Majors
Related Programs
Learn about other programs related to University of Cincinnati - Clermont College that might interest you.
Invest in the analytical and quantitative skills you need to succeed in a career in finance with this online bachelor's from Southern New Hampshire University.
BS in Business Administration - Finance
Increase your potential in nearly any industrial, financial, nonprofit or government organization with this online business administration bachelor's degree from Southern New Hampshire University.
MS in Finance - Corporate Finance
Acquire a thorough understanding of the financial landscape and prepare for a high-level corporate role with this specialized online graduate degree from Southern New Hampshire University.
Careers That Finance Grads May Go Into
A degree in finance can lead to the following careers. Since job numbers and average salaries can vary by geographic location, we have only included the numbers for OH, the home state for University of Cincinnati - Clermont College.
| Occupation | Jobs in OH | Average Salary in OH |
|---|---|---|
| General and Operations Managers | 58,980 | $118,470 |
| Financial Managers | 19,980 | $135,610 |
| Tellers | 18,080 | $28,990 |
| Securities, Commodities, and Financial Services Sales Agents | 13,300 | $77,960 |
| Bill and Account Collectors | 11,800 | $35,900 |
References
*The racial-ethnic minorities count is calculated by taking the total number of students and subtracting white students, international students, and students whose race/ethnicity was unknown. This number is then divided by the total number of students at the school to obtain the racial-ethnic minorities percentage.
More about our data sources and methodologies.
Course Advisor provides higher-education, college and university, degree, program, career, salary, and other helpful information to students, faculty, institutions, and other internet audiences. Presented information and data are subject to change. Inclusion on this website does not imply or represent a direct relationship with the company, school, or brand. Information, though believed correct at time of publication, may not be correct, and no warranty is provided. Contact the schools to verify any information before relying on it. Financial aid may be available for those who qualify. The displayed options may include sponsored or recommended results, not necessarily based on your preferences.
© Course Advisor – All Rights Reserved.