Union Bible College Overview
Union Bible College is a private not-for-profit institution located in Westfield, Indiana. Union Bible College is located in a safe and convenient suburb.
What Is Union Bible College Known For?
- Students who want to work more closely with their professors have an easier time at Union Bible College since the student to facuty ratio is 9 to 1.
- The bachelor's degree is the highest award offered at Union Bible College.
- During a recent academic cycle, 38% of the faculty were full-time.
Where Is Union Bible College?
Contact details for Union Bible College are given below.
| Contact Details | |
|---|---|
| Address: | 434 S. Union Street, Westfield, IN 46074-0900 |
| Phone: | 317-896-9324 |
| Website: | ubca.org |
How Do I Get Into Union Bible College?
You can apply to Union Bible College online at: https://ubca.org/apply
Admission Requirements for Union Bible College
| Submission | Required? |
|---|---|
| High School GPA | 5 |
| High School Rank | 5 |
| High School Transcript | 1 |
| College Prep Program | 5 |
| Recommendations | 1 |
| SAT or ACT Scores | 5 |
| TOEFL | 1 |
How Hard Is It To Get Into Union Bible College?
Approximately 43% of accepted students are men and 57% are women. The acceptance rate for men is 91%, and the acceptance rate for women is 88%.
Can I Afford Union Bible College?
Explore Best Ranked Schools for You
Union Bible College Undergraduate Student Diversity
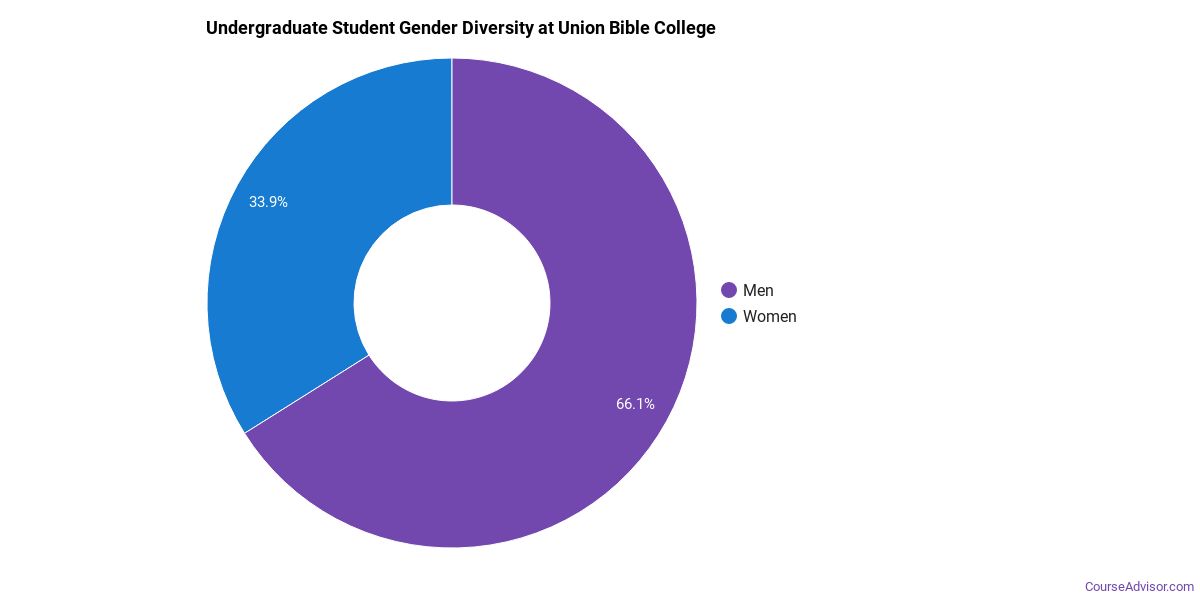
Gender Diversity
Of the 47 full-time undergraduates at Union Bible College, 62% are male and 38% are female.
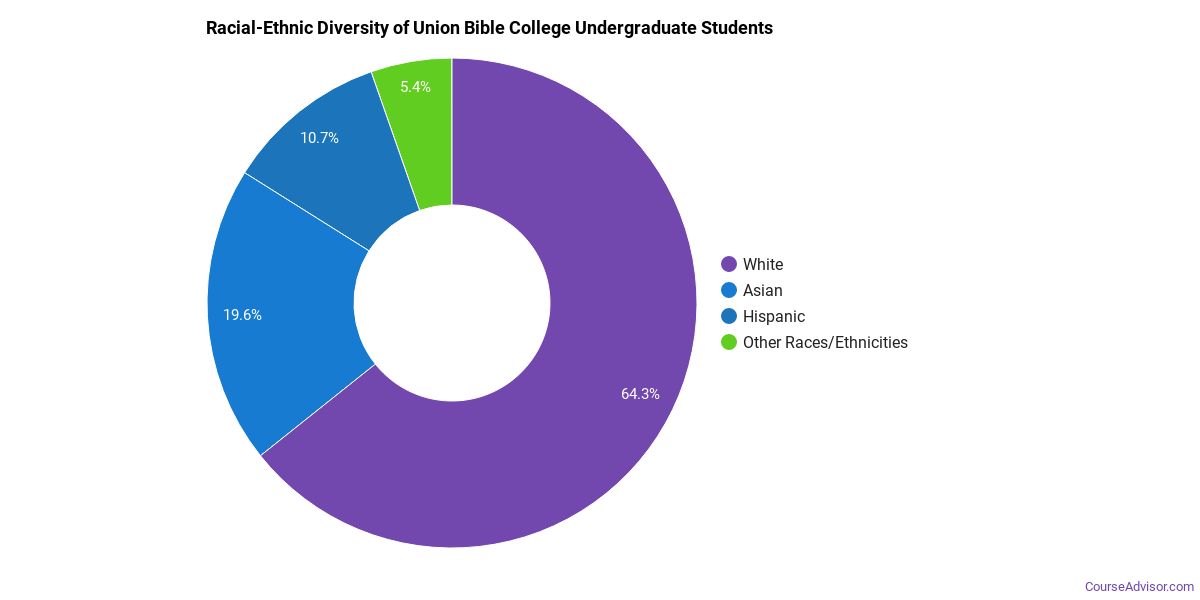
Racial-Ethnic Diversity
The racial-ethnic breakdown of Union Bible College students is as follows.
| Race/Ethnicity | Number of Grads |
|---|---|
| Asian | 1 |
| Black or African American | 0 |
| Hispanic or Latino | 3 |
| White | 41 |
| International Students | 1 |
| Other Races/Ethnicities | 1 |
Union Bible College Undergraduate Concentrations
The table below shows the number of awards for each concentration.
| Major | Basic Certificate | Associate’s | Bachelor’s | TOTAL |
|---|---|---|---|---|
| Biblical Studies | 5 | 0 | 0 | 5 |
| Pastoral Counseling & Specialized Ministries | 0 | 0 | 2 | 2 |
| Sacred Music | 0 | 1 | 1 | 2 |
| Business Administration & Management | 0 | 1 | 0 | 1 |
| Teacher Education Grade Specific | 0 | 0 | 0 | 0 |
| Missionary Studies | 0 | 0 | 0 | 0 |
| Theology & Religious Vocations (Other) | 0 | 0 | 0 | 0 |
| Theological & Ministerial Studies | 0 | 0 | 0 | 0 |
| TOTAL | 5 | 2 | 3 | 10 |
References
*The racial-ethnic minorities count is calculated by taking the total number of students and subtracting white students, international students, and students whose race/ethnicity was unknown. This number is then divided by the total number of students at the school to obtain the racial-ethnic minorities percentage.
More about our data sources and methodologies.
Course Advisor provides higher-education, college and university, degree, program, career, salary, and other helpful information to students, faculty, institutions, and other internet audiences. Presented information and data are subject to change. Inclusion on this website does not imply or represent a direct relationship with the company, school, or brand. Information, though believed correct at time of publication, may not be correct, and no warranty is provided. Contact the schools to verify any information before relying on it. Financial aid may be available for those who qualify. The displayed options may include sponsored or recommended results, not necessarily based on your preferences.
© Course Advisor – All Rights Reserved.