Tri-County Community College Overview
Tri-County Community College is a public institution situated in Murphy, North Carolina. The rural area surrounding Tri-County Community College is great for students who love a peaceful atmosphere.
What Is Tri-County Community College Known For?
- Students who want to work more closely with their professors have an easier time at Tri-County Community College since the student to facuty ratio is 10 to 1.
- The highest award offered at Tri-County Community College is the associate's degree.
- During a recent academic cycle, 23% of the faculty were full-time.
Where Is Tri-County Community College?
Contact details for Tri-County Community College are given below.
| Contact Details | |
|---|---|
| Address: | 21 Campus Circle, Murphy, NC 28906 |
| Phone: | 828-837-6810 |
| Website: | www.tricountycc.edu |
How Do I Get Into Tri-County Community College?
You can apply to Tri-County Community College online at: https://www.tricountycc.edu/applying-to-tri-county-community-college-ncrds/
Can I Afford Tri-County Community College?
Explore Best Ranked Schools for You
Tri-County Community College Undergraduate Student Diversity
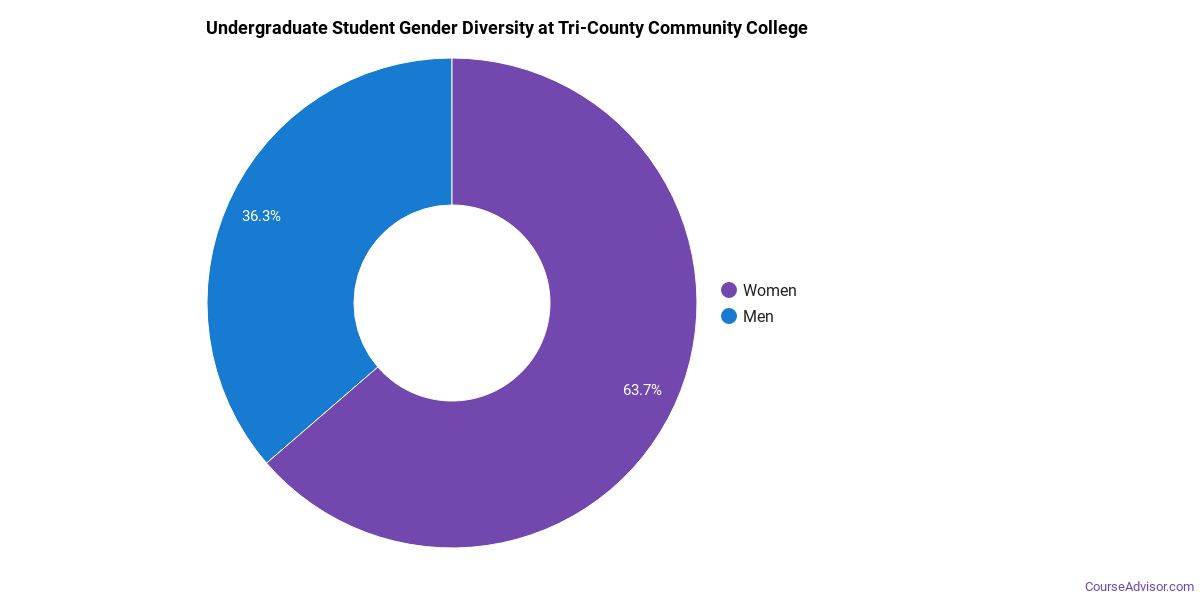
Gender Diversity
Of the 427 full-time undergraduates at Tri-County Community College, 38% are male and 62% are female.
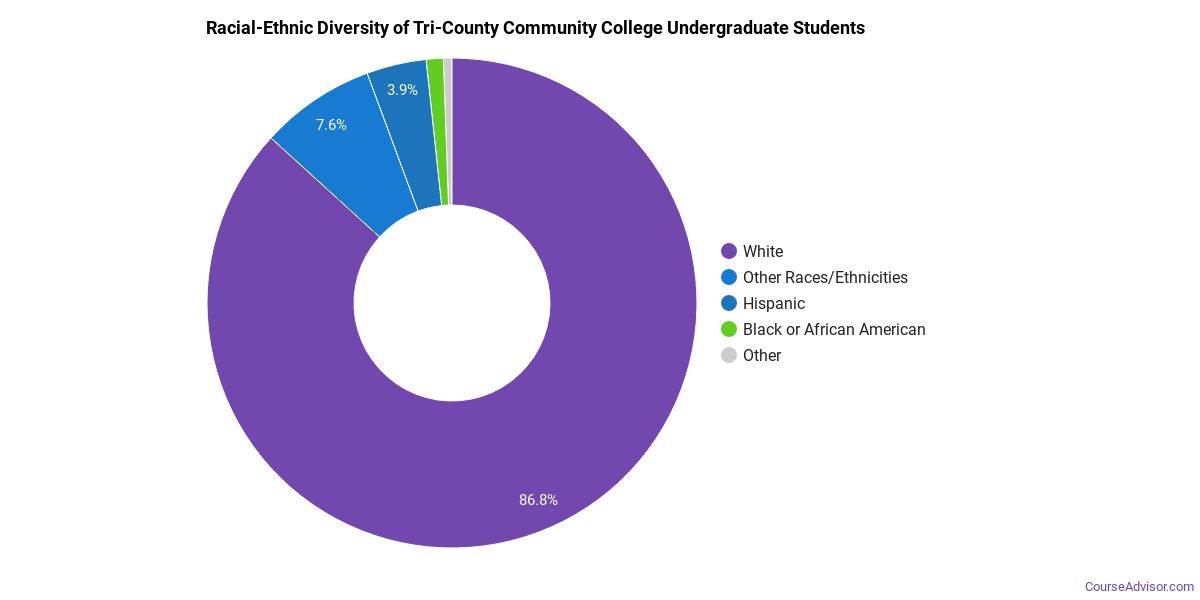
Racial-Ethnic Diversity
The racial-ethnic breakdown of Tri-County Community College students is as follows.
| Race/Ethnicity | Number of Grads |
|---|---|
| Asian | 4 |
| Black or African American | 2 |
| Hispanic or Latino | 16 |
| White | 383 |
| International Students | 1 |
| Other Races/Ethnicities | 21 |
Tri-County Community College Undergraduate Concentrations
The table below shows the number of awards for each concentration.
| Major | Basic Certificate | Associate’s | Undergraduate Certificate | TOTAL |
|---|---|---|---|---|
| Liberal Arts General Studies | 0 | 167 | 0 | 167 |
| Cosmetology | 7 | 3 | 6 | 16 |
| Nursing | 0 | 12 | 0 | 12 |
| Precision Metal Working | 6 | 2 | 1 | 9 |
| Vehicle Maintenance & Repair | 0 | 7 | 1 | 8 |
| Business Administration & Management | 0 | 6 | 0 | 6 |
| Teacher Education Grade Specific | 0 | 4 | 0 | 4 |
| Allied Health & Medical Assisting Services | 0 | 4 | 0 | 4 |
| Mental & Social Health Services | 0 | 4 | 0 | 4 |
| Allied Health Professions | 0 | 3 | 0 | 3 |
| Culinary Arts | 0 | 3 | 0 | 3 |
| Criminal Justice & Corrections | 0 | 3 | 0 | 3 |
| Accounting | 1 | 1 | 0 | 2 |
| Electromechanical Engineering Technology | 0 | 2 | 0 | 2 |
| Health & Medical Administrative Services | 1 | 1 | 0 | 2 |
| Health/Medical Prep Programs | 0 | 2 | 0 | 2 |
| Computer Information Systems | 0 | 1 | 0 | 1 |
| Electrical & Power Transmission Installers | 0 | 1 | 0 | 1 |
| Electronics Engineering Technology | 0 | 1 | 0 | 1 |
| Heating, Air Conditioning, Ventilation & Refrigeration | 0 | 1 | 0 | 1 |
| General Engineering | 0 | 0 | 0 | 0 |
| Rehabilitation & Therapeutic Professions | 0 | 0 | 0 | 0 |
| Somatic Bodywork & Therapeutic Services | 0 | 0 | 0 | 0 |
| TOTAL | 15 | 228 | 8 | 251 |
References
*The racial-ethnic minorities count is calculated by taking the total number of students and subtracting white students, international students, and students whose race/ethnicity was unknown. This number is then divided by the total number of students at the school to obtain the racial-ethnic minorities percentage.
More about our data sources and methodologies.
Course Advisor provides higher-education, college and university, degree, program, career, salary, and other helpful information to students, faculty, institutions, and other internet audiences. Presented information and data are subject to change. Inclusion on this website does not imply or represent a direct relationship with the company, school, or brand. Information, though believed correct at time of publication, may not be correct, and no warranty is provided. Contact the schools to verify any information before relying on it. Financial aid may be available for those who qualify. The displayed options may include sponsored or recommended results, not necessarily based on your preferences.
© Course Advisor – All Rights Reserved.